FireWeatherMet Account Talk

Doesn't it feel good to hit it just right sometimes? Congratulations!!!
Thanks RangerRay.
You had the same idea. That cutoff time can be tricky, esp with the extra steps needed to log into ones TSP.gov account these days. I've missed many an IFT by 30 sec or so.
 
Hoping todays up-day holds, which would raise me into positive territory for Oct,,,using 1st IFT to sell on big upday and lock in short term profits.
So of course, since I'm selling, I'm sure we've bottomed...since I'm deviating from my system right now.:rolleyes:

Leaving 50/50 C/S position and going 100% G COB today.
 
Biggest question out there...IS OUR LONG TERM SECULAR BULL MARKET OVER?
I think that's too early to answer that question...but it brings up another better question...ARE WE LONG OVERDUE FOR A CORRECTION TO THE 200 DAY MA?

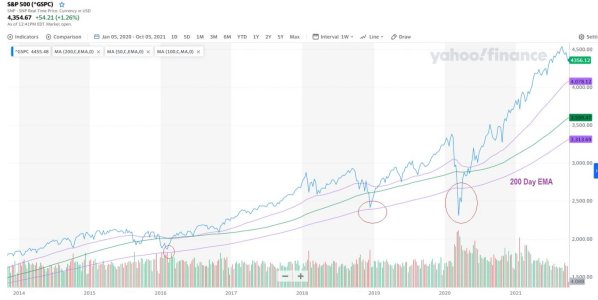
That might be a better question...looking at the past several years we've dropped to that one in late 2015...2018...and 2019 (COVID).
I've highlighted those points with a circle on the chart. FYI Yahoo charts go weekly after 1 year...so if you have to look at past years individually to see the daily data.

So far, since the chart is weekly for past several years, you can see we haven't even come close yet.
Inflation Fears...Labor Shortages...US Debt Default Threat...all occurring simultaneously...a scary triple threat. Just US threatening Ceiling default back 10 years ago took us well below the 200 EMA.
And the market seemed to already bake in 3.5 Trillion stimulus package...now that is in doubt.
Well, have a look at the chart and see how far we would still have to fall to reach 200 MA (again remember this is a weekly chart... on the daily w're closer to the 100 day EMA).

SP.jpg
 
Let's hope we don't or at least slowly fall to the 200 Day EMA. Compared to the 3 circles the distance fallen, though bad, was not huge compared to what it would look like if that were to happen know.
 
And yet, all investors need to hear is that the federal government has their backs and the bull market continues on.


Scott Harrison
Senatobia, MS
 
Hard to time a bottom, but sometimes a "Temporal" analysis is better than a "Technical" one (trying to guestimate if the 50, 100 or 200 MA will be the bottom).
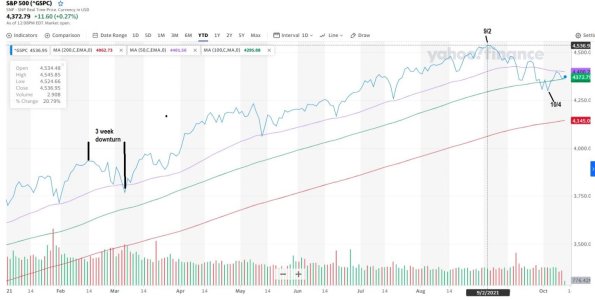
Since our most recent market top (Record High) on Sep 2nd we seem to have bottomed on Oct 4 (actually a double bottom). We've not had anything near month long drop since a 3 1/2 week drop mid Feb to early March.

So will roll the dice a bit, risk a bit more downtrend maybe, but not miss the early part of a possible bounce back (which tend to have the biggest up-days).
Using 2nd IFT of October to leave 100% G position and go 50% C and 50% S COB today.


SP.jpg
 
Best-O-Trading to ya FWM! (URRGGG)... I wanted to go in some today (not as deep as you, but that's relative to me) after looking at daily Market-Talk, etc., then busy with work & missed the IFT by 1 or 2 minutes. Thanks for posting your charts & thoughts here!
 
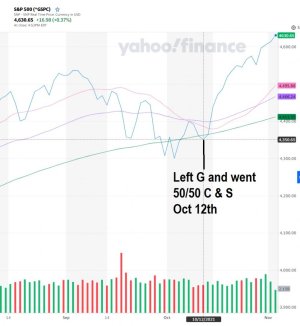
Recognizing a technical bottom on the charts has paid off...remembering the "Cramer-ism" of "Don't Fall in Love With the Downside".
Left the safety of cash, and jumped back into stocks on Oct 12th.

SP.jpg

This has been a nice ride for almost a month. A few times, I was tempted to jump ship but I try to remember the motto "Climbing the Wall of Worry".

WallofWorry.jpg
 
After todays big push in the S fund this AM...and another monthly IFT in hand, decided to briefly exit and lock in profits.
Kinda risky, with the Fed speech today, but feel that it could be a "Sell the News" if its dovish good news, or the start of steeper drop due to profit-taking if its more pessimistic.
Either way, up 7% in 3 weeks seems like a good time to lock in. Feel any downturn would be short...less than a week, before a rise to new highs, so I'll stay nimble and expect to get back in pretty soon.
Unless the Fed says.....:worried:

So using 1st Nov IFT to exit 50/50 C/S...and go 100% G COB today.
 
Been out of the market since early Nov, locking in over 2% gains those 1st few days.
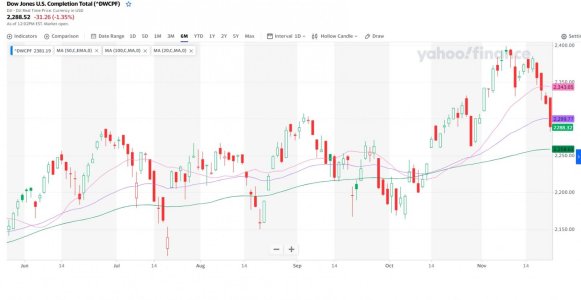
Now, with slight pullbacks last few days esp on small caps, where S fund is down almost 5% from its recent highs, and more importantly, down past 4 straight days, it might be time to get back in for what is usually a good, low volume time seasonally. Was going to go all into the C, but with the S plunging so much recently, and hitting its 50 Day MA (see chart below) thought that some of the best short term gains this holiday week might be in the small caps. We'll see.
Leaving 100% G and going 50/50 C and S COB today.

S- Fund.jpg
 
Tried sticking to a new system this year...one that during a Bull Market stays mostly "IN" equities, and just exits once every month or 2 at or near short term market peaks, for 2-5 days...but sometimes longer if the "peak" keeps rising. Used a combo of VIX and Sentiment Survey, along with chart patterns to determine those short term peaks.

The verdict...well...mixed.
If you had told me back last January 2021 that at the end of the year the S-Fund would be up 12%, and that I would be beating the S by nearly 8%, I would have imagined this system working beyond my wildest dreams, and that maybe I'd even be getting one of those cool coffee mugs for finishing at the top of the Tracker (lol)!

But...my mistake, and my weakness, was not knowing what the right fund would be to target, and stay in most of the time. Given that the S-fund has been our top fund during most bull market years, I just assumed that was where I would park my $$ this year. But it became apparent as the year went on that the C-fund was outperforming the S. To make matters worse, there were micro-cycles of 1-2 weeks where the S outperformed the C, and it seemed that when I made some decisions to go into stocks, and changed from the S to the C, I did it at precisely the wrong times, when the S had its occasional big runs, limiting the gains I would make, despite timing some market peaks nearly perfectly. By the latter part of the year, I stopped trying to guess, and kept my stock allocations mostly 50/50 C and S.

So sitting at 20.36%...am beating the S (12.55%)...I (11.32%)...F (-1.44%) and G (1.37%) handily. But the true target this year was the C (29.21%) and I totally missed that. ;damnit

So now, with still 2 Dec IFT's at hand, and 2 business days left, I'll likely make an IFT either today or tomorrow, to change from my 50/50 S/C allocation that I've kept since Nov, and go mostly, or all into the C, heading into the Ne Year. Happy New Years to all and wishing you all happy returns for 2022!
 
Congratulations FireWeatherMet! Your returns are awesome! You rocked it out. :banana:
Best wishes to you in the coming New Year!

Hummm... Did you use a sentiment survey as a contra-indicator?
 
Congratulations FireWeatherMet! Your returns are awesome! You rocked it out. :banana:
Best wishes to you in the coming New Year!

Hummm... Did you use a sentiment survey as a contra-indicator?

Thanks DB!
Just the way SS was meant to be used...Overly Positive Sentiment was a sell signal. But I would say I only weighted it 20% or so...the other 80% was VIX being at a short term low and looking for an overextended stretch on the charts.
 
Stayed the course invested 100% in -C- thru January, only saving grace was NOT losing as much as Small Caps.
Now riding the bounce, and questions about whether this is the "bottom" or "Deadcat Bounce"?
I am leaning towards the latter, but feel that we could see another few days of follow-thru, perhaps back up to the 100 Day or 50 Day EMA's, both of which are fairly close together (chart below).

Since small caps are more beaten down, and have "bounced" faster in the past day or 2...I've used my first Jan IFT on the last day of Jan to re-position into the S and try to make some short term gains on this potential bounce.
But being fully in the S is still a bit stressful for me...so am leaving my 100% C position and going in 75% S and 25% C COB Today since that ratio simply lets me sleep a bit better at night.:worried:

One bit of positive news for the Bull Argument that we reached the bottom, one of the Fed Chiefs (Daly) made a comment along the lines of WHILE RATE HIKES ARE LIKELY, THE FED WILL REMAIN FLEXIBLE AND NOT OVERREACT.
So when (or IF) we approach that 50/100 Day EMA point (star), I'll reassess whats going on and see if I use my 1st Feb IFT to go into safety and look for lower lows...or stay in longer.


SP.jpg
 
I'm going to give it a few days/a week and make the same move.

I'm still 45% in the market, so I am sharing in the gains while limiting my losses. If things accelerate on the rebound I will overweight S since it will lead C/I. If it rebounds for a week I don't think we are talking a dead cat bounce.

Time will tell.
 
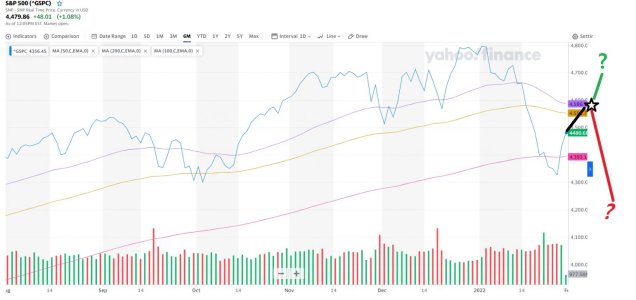
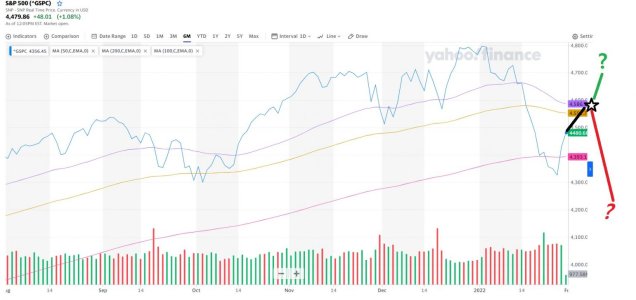
A few days ago I was eyeing the convergence zone of the 50 and 100 EMA's as a possible target on the S&P for the current bounce (below).

SP.jpg

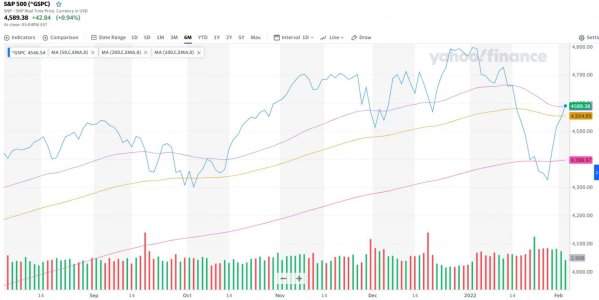
Well, we reached that today and nudged just a bit beyond it (below).

SP2.jpg

A decision now remains on whether to lock in this "bounce" in anticipation of another low, or retest of the old lows.
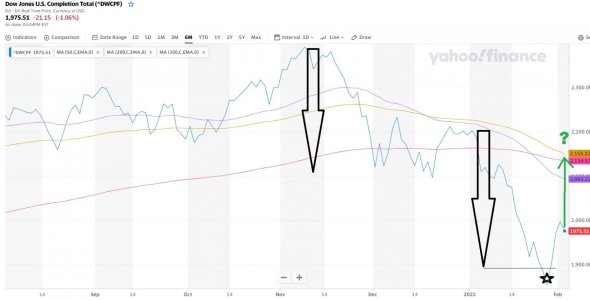
Even though I'm using the S&P 500 chart as a barometer of the market, its worth looking at the S Fund chart, which gives some argument of reaching the bottom.
It has a peak in Nov, followed by a 22% downturn over 2 1/2 months, with some complexities including a double tailed drop of a bounce in the middle of the drop which measures not too far from the recent S Fund low (below). Will have to make some decisions Thursday morning whether to move to safety, or stay the course. Always listening to others opinions, so feel free to chime in.


S Fund.jpg
 
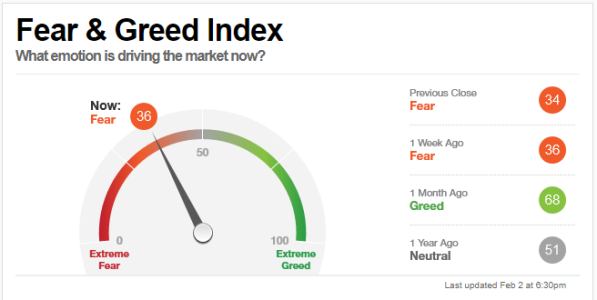
I'm keeping a close eye on things too, but what do you think about timeframe? Even though the market is still fearful and it wouldn't take much to instigate panic selling, they also generally know that the rate hike won't come for another 4 weeks. That's pretty much set in stone. I would think that would offer a little leeway for some more possible gains for at least next week before traders run for cover.
Outside of Russia infiltrating and invading Ukraine, I can't thing of any other event that would trigger a sell off. I'm just thinking out loud here...... :D

CaptureD.PNG
 
I think we go back down tomorrow and Friday. Facebook was a killer today, Amazon earnings probably not gonna help much. We've had a nice bounce, think that ends tomorrow. I got some SPY puts in for next few days. I'd wait till Monday at least to reenter. Best of luck!
 
I'm keeping a close eye on things too, but what do you think about timeframe? Even though the market is still fearful and it wouldn't take much to instigate panic selling, they also generally know that the rate hike won't come for another 4 weeks. That's pretty much set in stone. I would think that would offer a little leeway for some more possible gains for at least next week before traders run for cover.
Outside of Russia infiltrating and invading Ukraine, I can't thing of any other event that would trigger a sell off. I'm just thinking out loud here...... :D

View attachment 53161

Where was the Fear Index week ago?
The trend is what I would be following, if it was lower a week ago, then maybe we've bottomed??
 
Back
Top