FireWeatherMet
Market Veteran
- Reaction score
- 239
- AutoTracker

After years of polluting other peoples threads figured I'd just start start my own.
I consider myself 50% Chartist and 50% Economic News Junkie and try to weigh both in before making a decision.
So with that...despite feeling very bullish with the overall market and economy past few weeks I am pulling out to safety (50% G and 50% F).
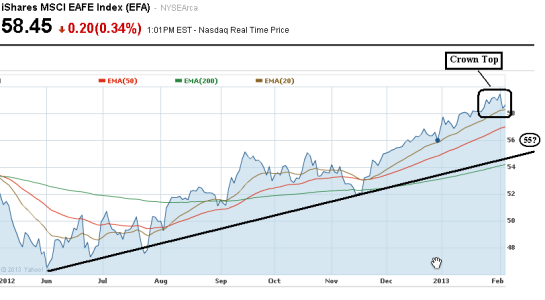
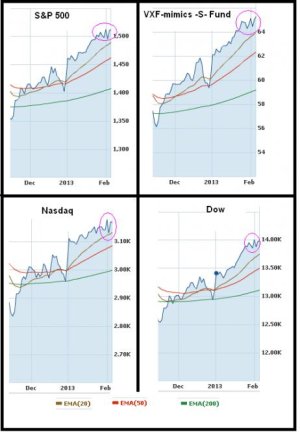
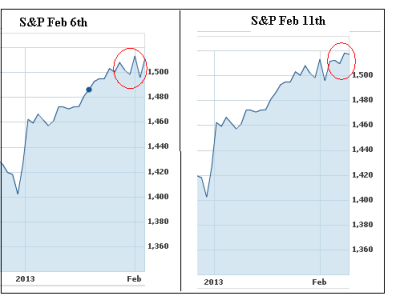
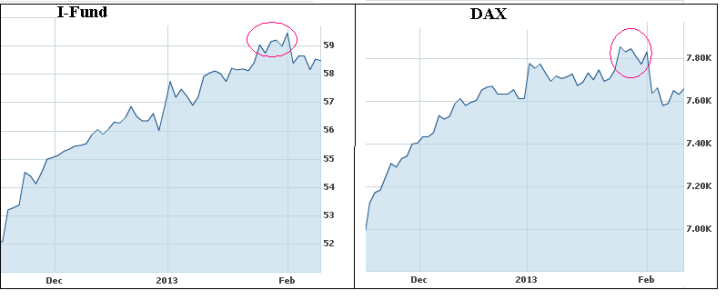
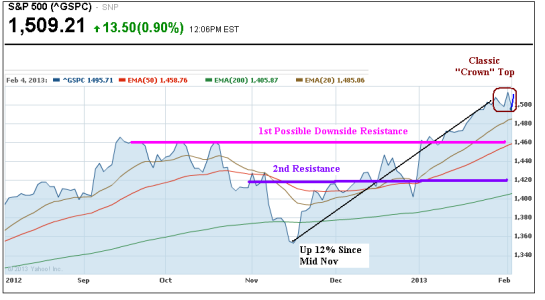
After any runup of 10% or more over a short time period you have to start looking for market topping patterns, otherwise you risk taking 9 steps back after taking 10 steps forward. Well, if things close as they are around the IFT deadline, then we've just finished the 3rd and usually final point of the classic crowning pattern (see S&P chart below).
I thought Fridays action took us past any forming top, but now it seems that it just formed the 2nd peak, and its been pointed out to me by Mr Bowl that often that 2nd point ends up being the highest.
So, decided to bail, but also noticed the -F- fund is at a 10 month low, so my parachute is made up of half F as well as half G. Did not want to go "all F" in case this is a false top (which sometimes happen). Will take my 2 to 2.5% YTD and preserve it for what could be our next good runup.
So with that, the next question is "How Low Will We Go"?
2 levels come to mind off the charts.
1st restance level as I see it would be around 1460. This is near both the 50 day EMA (exponential Moving Avg) and Sep-Oct triple peak. This would be about a 3% fall.
2nd resistance level a bit more ominous...near 1420. This is near the mean trendline of our Nov-Dec levels (minus the brief mid-Nov drop). Also near the 200 day EMA which is what our more significant corrections end up being. Feel that this is the "worst case scenario". this would be a 6% correction
So my thoughts are most likely somewhere in the middle...around 1440, or about a 4-5% correction.
Then again I always believe in staying fluid, so if some great economic news comes out, and market blasts past current top, I'll quickly jump back in, but until then...I'm out.


