06/20/25
The pre-holiday action was flat and mixed and of course punctuated by the Fed meeting where the Fed did not make any changes, but Jerome Powell sounded a little less optimistic and concerned about the unknown. Nothing is ever known, but the charts are trying to tell us something, and see it as a positive going forward, even if there is some negative short-term reaction to the Middle East situation.
It feels like a Monday after the Juneteenth holiday, but it's Friday already and we have a weekend coming up with a lot of question marks regarding the US involvement in the Israel / Iran conflict. The last I heard was that there is some early July deadline (July 3?) for Iran to make a deal, or the US will join the fight.
I don't know what this will do to the stock market in the coming months, but something like this tends to have a negative short-term impact, but maybe even short enough to be a buy the dip opportunity. Many investors have still been leaning the wrong way since the April lows expecting the worst from the tariffs, the economy, inflation, etc., and adding the Middle Eat conflict may have left them on the sidelines even longer. Is this going to be their opportunity to jump into the new bull market, or is there still too much unknown?
The Fed's kept interest rates at the current level after their meeting last week, and Powell was a little hawkish at the press conference, but still vague and full of uncertainty. That left the market rather choppy, so it was choppy going into the meeting, and after.
The futures were down moderately last night but the charts suggest good things are coming, it's likely a matter of when and how much more consolidation we may get in the interim.
The S&P 500 (C-fund) has been flirting with a breakdown below the May peak, and if the futures remain negative into Friday's open, that support near 5980 could give way. There are still plenty of other support areas just below 5980 and the June seasonality calendar that I showed on Wednesday does suggest a few more days of a bearish bias. Perhaps that means the 20-day EMA or the open gap near 5800 will get tested. The 50-day EMA is near 5831 so that's another potential pullback target if those futures don't turn around by Friday morning.

The 10-year Treasury Yield was up slightly following the FOMC meeting, after being down most of the day, and once again holding at the bottom of that red trading channel. The 200-day average is also holding.

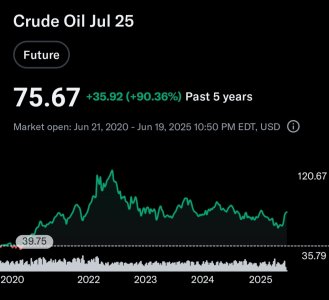
The price of crude oil has certainly been part of the discussion. It is obviously a result of the action in the Middle East as investors expect possible supply disruption, but also summer driving will drive up demand so it's a double whammy for oil prices. There is still resistance at the recent highs near 75, and the 200-day average is just below 80 as a possible target. If Iran does make a deal, this would likely fall quickly.

The Dow Transportation Index has formed a small bear flag off the recent high but the index remains above some key support levels. The 50-day EMA is holding firm, and the old blue resistance line is acting as support as well. If that bear flag breaks, there is an open gap down near 14,000 and that would certainly change the look of this chart if that were to get tested.

Like the S&P 500, the other stock indices are not failing by any means. As a matter of fact, they have held up very well under the current circumstances. The Nasdaq 100, or QQQ, is forming the right shoulder of a very bullish looking inverted head and shoulders pattern. In the short term the right shoulder may need more time to develop, or not, but whether the shoulder forms or not, these patterns tend to break to the upside, so I would expect the news headlines to get more favorable in the coming weeks and months, as the charts are trying to tell us something positive.

There is nothing on the economic calendar for today so the market may be driven more by the geopolitical headlines. It is a Triple Witching expiration day however, so trading volume will be very high, and it could mean Monday will be a turning point of some sort - but which way will it turn?
The DWCPF / S-fund is sitting on the lower end of a rising wedge pattern. Those are patterns that do tend to break down so the negative futures quotes are concerning, but the consolidating is not a bad thinking looking out a little further. And, even if the wedge does break, there is decent support between 2150 and 2175.

The ACWX (I-fund) broke down earlier this week as the dollar has picked up some steam and so far the double bottom in UUP is holding. The I-fund has been due for a pullback but how much damage can be done if the dollar does continue to rise? Can the US TSP funds rally if this one starts to rollover? We know from the 2025 returns how much they can bifurcate for a while.

BND / F-fund popped back above that small resistance line near 72.25 again, and it held at the close. Bonds may be trying to make a move higher, which means lower yields and a possible catalyst for stocks.

Thanks so much for reading! Have a great weekend!
Tom Crowley
Read more in today's TSP Talk Plus Report. We post more charts, indicators and analysis, plus discuss the allocations of the TSP and ETF Systems. For more information on how to gain access and a list of the benefits of being a subscriber, please go to: www.tsptalk.com/plus.php

Questions, comments, or issues with today's commentary? We can discuss it in the Forum.
Daily Market Commentary Archives
For more info our other premium services, please go here... www.tsptalk.com/premiums.php
To get weekly or daily notifications when we post new commentary, sign up HERE.
Posted daily at www.tsptalk.com/comments.php
The legal stuff: This information is for educational purposes only! This is not advice or a recommendation. We do not give investment advice. Do not act on this data. Do not buy, sell or trade the funds mentioned herein based on this information. We may trade these funds differently than discussed above. We may use additional methods and strategies to determine fund positions.
The pre-holiday action was flat and mixed and of course punctuated by the Fed meeting where the Fed did not make any changes, but Jerome Powell sounded a little less optimistic and concerned about the unknown. Nothing is ever known, but the charts are trying to tell us something, and see it as a positive going forward, even if there is some negative short-term reaction to the Middle East situation.

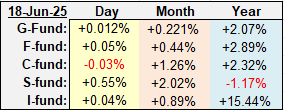
| Daily TSP Funds Return More returns |
It feels like a Monday after the Juneteenth holiday, but it's Friday already and we have a weekend coming up with a lot of question marks regarding the US involvement in the Israel / Iran conflict. The last I heard was that there is some early July deadline (July 3?) for Iran to make a deal, or the US will join the fight.
I don't know what this will do to the stock market in the coming months, but something like this tends to have a negative short-term impact, but maybe even short enough to be a buy the dip opportunity. Many investors have still been leaning the wrong way since the April lows expecting the worst from the tariffs, the economy, inflation, etc., and adding the Middle Eat conflict may have left them on the sidelines even longer. Is this going to be their opportunity to jump into the new bull market, or is there still too much unknown?
The Fed's kept interest rates at the current level after their meeting last week, and Powell was a little hawkish at the press conference, but still vague and full of uncertainty. That left the market rather choppy, so it was choppy going into the meeting, and after.
The futures were down moderately last night but the charts suggest good things are coming, it's likely a matter of when and how much more consolidation we may get in the interim.
The S&P 500 (C-fund) has been flirting with a breakdown below the May peak, and if the futures remain negative into Friday's open, that support near 5980 could give way. There are still plenty of other support areas just below 5980 and the June seasonality calendar that I showed on Wednesday does suggest a few more days of a bearish bias. Perhaps that means the 20-day EMA or the open gap near 5800 will get tested. The 50-day EMA is near 5831 so that's another potential pullback target if those futures don't turn around by Friday morning.

The 10-year Treasury Yield was up slightly following the FOMC meeting, after being down most of the day, and once again holding at the bottom of that red trading channel. The 200-day average is also holding.

The price of crude oil has certainly been part of the discussion. It is obviously a result of the action in the Middle East as investors expect possible supply disruption, but also summer driving will drive up demand so it's a double whammy for oil prices. There is still resistance at the recent highs near 75, and the 200-day average is just below 80 as a possible target. If Iran does make a deal, this would likely fall quickly.

The Dow Transportation Index has formed a small bear flag off the recent high but the index remains above some key support levels. The 50-day EMA is holding firm, and the old blue resistance line is acting as support as well. If that bear flag breaks, there is an open gap down near 14,000 and that would certainly change the look of this chart if that were to get tested.

Like the S&P 500, the other stock indices are not failing by any means. As a matter of fact, they have held up very well under the current circumstances. The Nasdaq 100, or QQQ, is forming the right shoulder of a very bullish looking inverted head and shoulders pattern. In the short term the right shoulder may need more time to develop, or not, but whether the shoulder forms or not, these patterns tend to break to the upside, so I would expect the news headlines to get more favorable in the coming weeks and months, as the charts are trying to tell us something positive.

There is nothing on the economic calendar for today so the market may be driven more by the geopolitical headlines. It is a Triple Witching expiration day however, so trading volume will be very high, and it could mean Monday will be a turning point of some sort - but which way will it turn?
The DWCPF / S-fund is sitting on the lower end of a rising wedge pattern. Those are patterns that do tend to break down so the negative futures quotes are concerning, but the consolidating is not a bad thinking looking out a little further. And, even if the wedge does break, there is decent support between 2150 and 2175.

The ACWX (I-fund) broke down earlier this week as the dollar has picked up some steam and so far the double bottom in UUP is holding. The I-fund has been due for a pullback but how much damage can be done if the dollar does continue to rise? Can the US TSP funds rally if this one starts to rollover? We know from the 2025 returns how much they can bifurcate for a while.

BND / F-fund popped back above that small resistance line near 72.25 again, and it held at the close. Bonds may be trying to make a move higher, which means lower yields and a possible catalyst for stocks.

Thanks so much for reading! Have a great weekend!
Tom Crowley
Read more in today's TSP Talk Plus Report. We post more charts, indicators and analysis, plus discuss the allocations of the TSP and ETF Systems. For more information on how to gain access and a list of the benefits of being a subscriber, please go to: www.tsptalk.com/plus.php

Questions, comments, or issues with today's commentary? We can discuss it in the Forum.
Daily Market Commentary Archives
For more info our other premium services, please go here... www.tsptalk.com/premiums.php
To get weekly or daily notifications when we post new commentary, sign up HERE.
Posted daily at www.tsptalk.com/comments.php
The legal stuff: This information is for educational purposes only! This is not advice or a recommendation. We do not give investment advice. Do not act on this data. Do not buy, sell or trade the funds mentioned herein based on this information. We may trade these funds differently than discussed above. We may use additional methods and strategies to determine fund positions.
Last edited:


