Tsunami's Account Talk

Have a wonderful trip TS. You driving by WSU on your way to the northern climes by any chance....Salute those Cougars as you go by..:D:D:D

FS
 
Sounds like a wonderful trip TS. And it is beautiful country. Don't know if you've had the chance, but get to Victoria, BC sometime. One of my favorite places on the planet. Safe travels.

PS: And yes, I think dumb can get dumber...:D:D:D

FS
 
Yes, those Rockies are beautiful country. We skied up there a few times years ago, not been in the summer. I 2nd the suggestion for West-Coast of BC too.
** BTW - CONGRATS !!! (for being Retirement Eligible in June (?)). I was so a year ago... would like to go now but financially it will be 2-to-5 years, then "cheers". Safe travels and investing to you (& all of us).
 
Sounds like a wonderful trip TS. And it is beautiful country. Don't know if you've had the chance, but get to Victoria, BC sometime. One of my favorite places on the planet. Safe travels.

PS: And yes, I think dumb can get dumber...:D:D:D

FS

Yup, having grown up in Washington I've been to Victoria 4 or 5 times (and Vancouver, including for Expo '86, back when Vancouver wasn't teaming with hoards of people like every good place is now). The best trip to Victoria was when we stayed in a condo overlooking the strait of Juan de Fuca at Point No Point. Sitting in a hot tub at sunset watching the ships pass by with the Olympic Mts. in the background, nice memories. Private rental cabins at Point No Point Resort near Sooke, BC
OK, wife is about ready, time to head to North Dakota and Theodore Roosevelt NP, then Mt. Rushmore tomorrow, the weather looks iffy tomorrow though...

I'm thinking the market has one more dip into tomorrow and maybe early next week per this cycle. That will fit my system well which says to get back in tomorrow.
Orderly Bull - Jaroslaw Jac - Public ChartList - StockCharts.com;
 
Finally getting a little momentum going today. If it's not squashed tomorrow I'm hoping for a peak around 2220 on or near this Friday with the jobs report.

That scenario would fit this cycle chart....

$SPX - SharpCharts Workbench - StockCharts.com

Then maybe a slightly higher high about a month later...

http://www.gunner24.com/uploads/RTEmagicC_SP500_weekly_3_Candle_G24up_3.jpg.jpg

All in all, not much movement for another month at least.....not much to talk/post about...vacation was great! I want another one LOL.
Here's some of the photos from the 2nd half of the trip...
https://goo.gl/photos/frNTYPFUuEBfRTXv7
 
Ts: Thx for sharing your charts & Pix!
icon14.png
 
If this panic follows the usual pattern I'd expect an initial low Monday or early Tuesday, then a strong 3-wave rally, then another fall to a low next Thursday or Friday...but the potential is there for something quite a bit worse.

This is one of the prettiest T's I've ever seen in small caps, and looks pretty ominous...
IWM - SharpCharts Workbench - StockCharts.com

Some scary looking symmetry here...
$SPXEW:$SPX - SharpCharts Workbench - StockCharts.com
(I'm not expecting anything like a 2008 crash here, in fact I still believe Craig Johnson's 2350 by year-end is doable)

And Peter Adams finally got the plunge he's been calling for weeks; but will it get as bad as he predicts? Time will tell. My system has me safely out for now, except sitting in the F fund hasn't been the usual safe haven since bonds are at the epicenter of this storm.... statistically, September is a great month for bonds though, so that's where I'll sit for a few more days and hope the fear of the Fed subsides soon...
Weekly Forecast: Week of September 5th, 2016

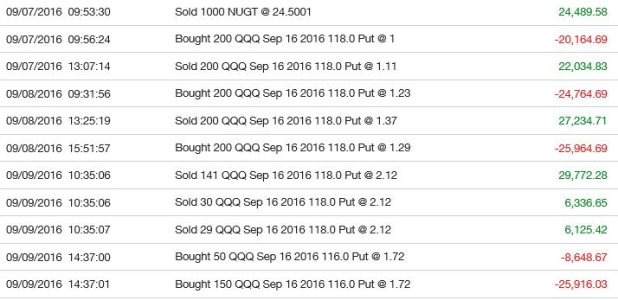
Oh, I don't want to get into a trade posting completion with Ripper, but for the record I sold the NUGT I held in two accounts at 24.50 a couple days ago for an 8% gain (thank goodness, I had a hunch from gurus I read that gold would correct further so I bailed out just in time)...then after waiting patiently for weeks for signs of volatility to show up I bought 200 contracts of $118 QQQ puts at the close yesterday, at $1.29...unfortunately I sold them early in the day today (at $2.12) for a relatively small gain to what I could have had (I had a doctor appointment and know better from past horror stories than to hold options in such an extreme market when you can't watch them, so I sold them for a mere 64% gain...if I'd held, by the close today they were at $4.12... a 224% gain!, argh, that would have been about enough profit in a single day ((4.12-1.29)*20,000 = $56,600) to buy my sweeties dream Audi Q5)....but at least I reloaded on the small rally with an hour to go in the day (200 contracts of $116 QQQ puts at $1.72) and will hopefully be adding to the retirement kitty Monday morning if the futures don't scream higher overnight Sunday. Thank you Wall Street Boys! A snippet from my account page...you gotta have a strong stomach for options, I've been doing it for about 14 years now and am finally getting the hang of it...
Trades.JPG

Now if my Cougs can upset the Broncos on the Smurf turf tomorrow that will make my weekend extra sweet!
 
Last edited:
Craig Johnson is sticking with his 2350 call...
Craig Johnson: Sticking to My Guns for a Positive Year-End | James J Puplava CFP | FINANCIAL SENSE

Might need to see Alevin's chart tick down a level before this silly panic hits bottom though...
S&P 500 vs S&P 500 Relative to its 5-Day Moving Average (S&P 500 R5) | Stock Market Indicators

And getting the 5-day TRIN to the top of this chart would help convince me that a bottom is near...
$TRIN - SharpCharts Workbench - StockCharts.com

Similarly, would like to see this ratio spike above 1.00...
$VIX:$VXV - SharpCharts Workbench - StockCharts.com

Wow, what a move in the VIX yesterday. I thought about buying UVXY in my IRA at the open but didn't, could have made 20% if I had...
$VIX - SharpCharts Workbench - StockCharts.com

This is also a useful tool in the toolbox for finding bottoms, and the blue EMA is nowhere near crossing below the red...
https://ttheoryforum.wordpress.com/...he-day-revisiting-the-magical-1939-ema-cross/
http://stockcharts.com/h-sc/ui?s=$SPX&p=D&yr=0&mn=10&dy=0&id=p33048889717

Interesting; according to this Trump is about to surge in the polls....
http://www.mcoscillator.com/learning_center/weekly_chart/djia_leads_poll_numbers/
 
Just to wrap up the comments on my options trades below, I sold at the open at $2.70/contract...for a profit of $19,269. Glad I did since only 10 minutes later it was down to $2.05! Options are insane and I'm not sure why I keep doing it. Time to step aside for a while (I'm 100% cash in the trading account), although I don't think this decline is quite done yet. Now it's time to focus on what day I should jump back in with my TSP and IRA.

...and my poor Cougs, they came storming back and with another 20 seconds or so would have pulled it out (just like Arizona last night, though I was glad to see them lose since it helps my Seahawks). So it was another 3 point loss. 480 yards by Luke Falk wasn't enough. Argh. Sometimes I think I should have gone to Udub...nah, no way!

Wow, those puts I sold are down to $1.89 now...$1.83...

Trade.JPG
 
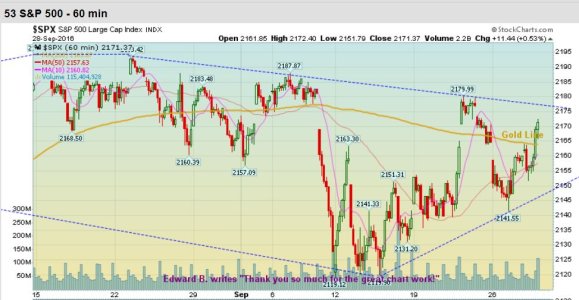
Looking for a bit more rally this morning up to the trend line around 2177. That will finish wave D of an apparent triangle that's brewing (starting from the early September peak at 2187). Then comes a small wave E pullback to no lower than that lower trend line at 2150ish (wave E's do not have to go all the way down to the trend line, so it could be a brief/shallow pullback), then there should be a blast off for 2 or 3 days into next week to above 2200 (maybe to 2211ish per my previous post below). That's today's theory anyway. I don't much care since I'm finally just following my system and not paying as much attention to the news and markets as I have been for many years.
Above the Green Line - Sep 28, 2016 Buy high, and Sell Higher: Momentum Investing - Joanne Klein - Public ChartList - StockCharts.com (chart #53 shows the triangle trend lines)

A top next week would also agree with Jeffrey Young's T expiring next week:
Jeffrey Young's Public Chart List - Jeffrey Young - Public ChartList - StockCharts.com (chart #1C)

Triangle.JPG
 
Taking longer than I thought, but could still get to 2177...

This is an amazing stat!

"the S&P 500 index has gained 699 points since January 2008, and 422 of those points came on the 70 Fed announcement days. The average gain on announcement days was 0.49%, or roughly 50 times higher than the average gain of 0.01% on other days."

Trump
 
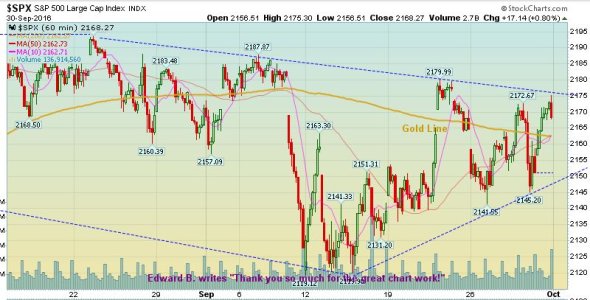
Well, it took one more zig down and a zag up but the S&P did reach the upper trend line just before the close Friday.

chart 53.JPG

Now I'm watching to see if that will matter on Monday. One new piece of news that could make it matter is that China finally has their currency added to the IMF's SDR basket of currencies starting today, 10/1/16. The effect on the U.S. dollar is minimal (the U.S. share of the basket only drops from 41.9% to 41.37%). However, much bigger, as of today the Euro's share drops from 37.4% to 30.93%, and the British pound plummets from 11.3% to 8.08%, or about 28%. It will be interesting to see if this affects European markets Monday, or if that even makes the news at all.

Go Cougs! Pluck some Duck feathers today.
 
Well the SPX finally broke out of the triangle, to the downside, and is now testing the underside. If it falls away to the downside tomorrow then Ed Carlson could be on to something with his latest 3 peaks/domed house pattern:
September 30- October 3 High | Ed Carlson | Safehaven.com

Per his 9/13/16 post here: George Lindsay, Seattle Technical Advisors Blog it looks like what would be next would be a fall to the 200dma in mid to late October, a rally, then another bigger fall into late November...which matches another guru I follow that uses cycles.
 
Yep, it looks like the jobs report provided the iceberg. The jump to 5.0% has also triggered rule #1 of the "perfect recession indicator".
In Search of the Perfect Recession Indicator | PHILOSOPHICAL ECONOMICS

5.0% is above the 12-month moving average, which is now 4.93%, for the first time since April of 2010! So by rule, you defer to the current S&P 500 price compared to it's 10-month moving average, which is 2075.62 by my chart (using month-end prices). So this indicator is now teetering on indicating an impending recession, and a drop below 2075 would trigger me to go to bear market rules, which is to just stay in the G of F funds until the charting method I use (which is similar to what DBA posted this morning with that Joanne Klein chart) indicates a bear market bottom. Using this method would have side-stepped a 38% drop in the 2000-03 bear market, and a 45% drop in the 2007-09 bear market.

Time to pay attention! I don't expect a drop below 2075 real soon (2100ish next week though), but maybe it happens next month per some guru's I read.
 
Back
Top