-
The Forum works well on MOBILE devices without an app: Just go to: https://forum.tsptalk.com
-
Please read our AutoTracker policy on the IFT deadline and remaining active. Thanks!
-
$ - Premium Service Content (Info) | AutoTracker Monthly Winners | Is Gmail et al, Blocking Our emails?
Find us on: Facebook & X | Posting Copyrighted Material
-
Join the TSP Talk AutoTracker: How to Get Started | Login | Main AutoTracker Page
You are using an out of date browser. It may not display this or other websites correctly.
You should upgrade or use an alternative browser.
You should upgrade or use an alternative browser.
MrJohnRoss' Account Talk
- Thread starter MrJohnRoss
- Start date
Cactus
TSP Pro
- Reaction score
- 38
That's interesting because Last Month's Best Fund was the C Fund, and S has less than a 1% lead over C as of yesterdays close. If this keeps up C might squeek into the lead again. It's not common to have the C Fund as the the best fund for 2 consecutive months. It has never happened in LMBF from 2004 - 2012. S follows C 2/3rds of the time during those years.
MrJohnRoss
Market Veteran
- Reaction score
- 58
An allocation split between S and C makes a lot of sense. Maybe a 60/40 mix. I would stay away from the I Fund for now.
Here's the relative strength graph of I vs S...
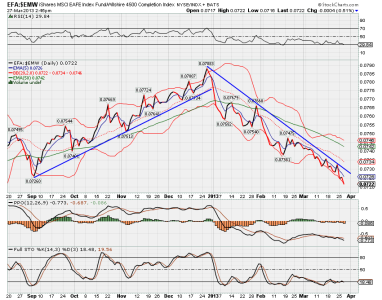
It's like a light switch turned off at the beginning of the year. I Fund was screaming hot at the end of 2012, and as soon as 2013 arrived, it really underperformed both the C and S Funds. No sign of a bottom yet. The strength in the US dollar is really hurting overseas investments. Until that downtrend line is broken, I'd stay away.
Good luck!
Here's the relative strength graph of I vs S...

It's like a light switch turned off at the beginning of the year. I Fund was screaming hot at the end of 2012, and as soon as 2013 arrived, it really underperformed both the C and S Funds. No sign of a bottom yet. The strength in the US dollar is really hurting overseas investments. Until that downtrend line is broken, I'd stay away.
Good luck!
MrJohnRoss
Market Veteran
- Reaction score
- 58
Well, it looks like I won't have to worry about getting out of the market. At least not right away, as this (so far) positive day is changing the technical picture for the better.
Don't know if there are any wave count pro's here, but it appears to me that we might have completed our 5 waves up, and we're getting set to start our three waves down. (See graph below) If so, today's rally may be short lived.
Good luck!
View attachment 22983
Here's another viewpoint of my previous post. From Daneric's Elliot Wave blog...
MrJohnRoss
Market Veteran
- Reaction score
- 58
MrJohnRoss
Market Veteran
- Reaction score
- 58
Someone asked me about my take on the Gold Miners. Here is what I think is happening...
Take a look at an indicator called the Gold Miners Bullish Percent Index, ticker $BPGDM:
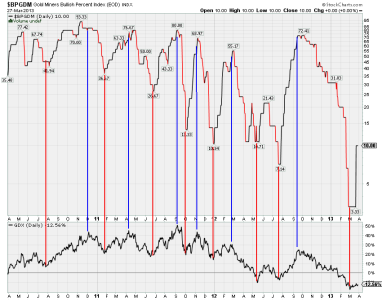
This is a three year chart of the index. In the bottom window is the popular Gold Miners Index, ticker GDX. (I could have used NUGT, but it doesn't have three year's worth of history).
I drew vertical blue lines at the major peaks on GDX, and a vertical red lines at the major bottoms on GDX.
What I noticed is that at the major peaks in GDX, the BPGDM was often above 70. A turn down in BPGDM would have been a good signal to move out of the Gold Miners.
Also notice that at major bottoms on GDX, the BPGDM had fallen from the 70 area, and then leveled out. It appears that a move higher in the BPGDM would indicate that the Gold Miners were set to move higher.
So what's going on currently? Notice on this chart that the BPGDM just formed a three year low, all the way down to a value of 3.33. GDX, GDXJ, and NUGT have been smashed.
Typically it's a good idea to buy a stock when it's hated and pummelled to death, and it begins to show life.
So the good news is that BPGDM just began a move higher in the last couple of days. This should be good news for holders of any of the gold mining companies and the ETF's that hold them. (I personally purchased a small amount of NUGT about a month ago at 6.05. It's currently at 5.68, so I'm about 6% under water).
If you're thinking of getting into the gold miners, now might be a good time. If you already bought a while back, and you're thinking of selling because you've lost money, you may want to hold on to see if the BPGDM will take these stocks and ETF's higher.
Best of luck to you...
Take a look at an indicator called the Gold Miners Bullish Percent Index, ticker $BPGDM:

This is a three year chart of the index. In the bottom window is the popular Gold Miners Index, ticker GDX. (I could have used NUGT, but it doesn't have three year's worth of history).
I drew vertical blue lines at the major peaks on GDX, and a vertical red lines at the major bottoms on GDX.
What I noticed is that at the major peaks in GDX, the BPGDM was often above 70. A turn down in BPGDM would have been a good signal to move out of the Gold Miners.
Also notice that at major bottoms on GDX, the BPGDM had fallen from the 70 area, and then leveled out. It appears that a move higher in the BPGDM would indicate that the Gold Miners were set to move higher.
So what's going on currently? Notice on this chart that the BPGDM just formed a three year low, all the way down to a value of 3.33. GDX, GDXJ, and NUGT have been smashed.
Typically it's a good idea to buy a stock when it's hated and pummelled to death, and it begins to show life.
So the good news is that BPGDM just began a move higher in the last couple of days. This should be good news for holders of any of the gold mining companies and the ETF's that hold them. (I personally purchased a small amount of NUGT about a month ago at 6.05. It's currently at 5.68, so I'm about 6% under water).
If you're thinking of getting into the gold miners, now might be a good time. If you already bought a while back, and you're thinking of selling because you've lost money, you may want to hold on to see if the BPGDM will take these stocks and ETF's higher.
Best of luck to you...
bmneveu
TSP Pro
- Reaction score
- 91
One of the things I'm finding interesting right now, is the relative strength of the large caps vs small caps (C vs S). Looks like we are rotating back in favor of large caps (C Fund). See chart below:
View attachment 23075
This chart shows the relative performance of S vs C (or a close proximity of these funds). When S is outperforming, the line slopes higher. When S underperforms, the line slopes lower. Looks like the rising trendline has been broken, and the technical indicators are turning lower as well (blue circles). However, keep in mind that the last rotation only lasted a few weeks. Will this time be different? Your guess is as good as mine. For right now, at least, the C Fund is the place to be.
Good luck!
I think the last few days are telling us that you hit the nail on the head here!
RealMoneyIssues
TSP Legend
- Reaction score
- 101
One of the things I'm finding interesting right now, is the relative strength of the large caps vs small caps (C vs S). Looks like we are rotating back in favor of large caps (C Fund). See chart below:
View attachment 23075
This chart shows the relative performance of S vs C (or a close proximity of these funds). When S is outperforming, the line slopes higher. When S underperforms, the line slopes lower. Looks like the rising trendline has been broken, and the technical indicators are turning lower as well (blue circles). However, keep in mind that the last rotation only lasted a few weeks. Will this time be different? Your guess is as good as mine. For right now, at least, the C Fund is the place to be.
Good luck!
I think the last few days are telling us that you hit the nail on the head here!
Large Cap Strength over Small Caps isn't a good thing, so maybe some caution moving forward would be prudent...
JTH
TSP Legend
- Reaction score
- 1,158
I think the last few days are telling us that you hit the nail on the head here!
Problem is the rotation shoud have already taken place with the end of the quarter...
MrJohnRoss
Market Veteran
- Reaction score
- 58
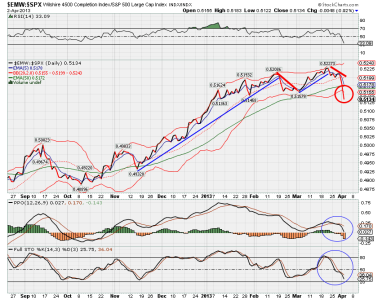
Here's an updated chart on the S Fund vs C Fund. As JTH said, this appears to be a market warning.
We could very likely see small caps bounce back strongly tomorrow. If not, consider the small caps to be market leaders, which are heading down. S&P and DJIA are still strong, but the Transports have been on a sell for a week, which is another market leader. And even though the I Fund was very strong today, it's been on a sell for several weeks.
I'm not liking this market, but again, I'm going to hold on a little longer until we see more evidence of a market correction.

MrJohnRoss
Market Veteran
- Reaction score
- 58
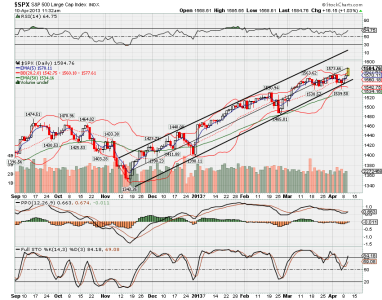
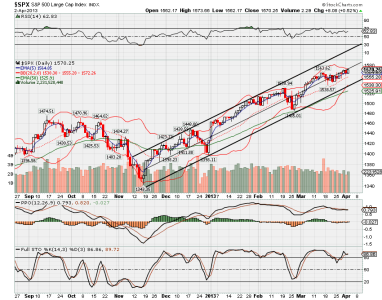
Here's a view of the S&P. It's in the middle of it's trading channel. It's tested the lower support line three times in the last few months, and bounced back sharply every time. I would be a seller of equities if we significantly violate that lower line.
On the flip side, you might consider hedging your long positions. I went long SRTY recently.
On the flip side, you might consider hedging your long positions. I went long SRTY recently.

MrJohnRoss
Market Veteran
- Reaction score
- 58
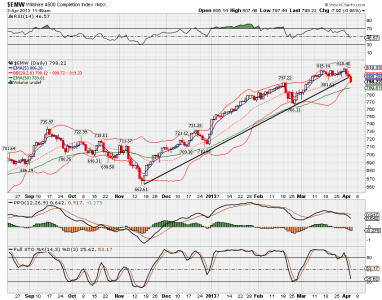
The downturn in the S Fund has intensified. Decided to move to cash rather than wait until the S&P follows suit. Hopefully this isn't another short term move down to shake out the weak hands. The last few times we saw this, the market roared back in massive up moves, and I've missed out. That's why my YTD numbers are so low. You may not want to follow my advice.
The good news is SRTY is on a tear.
Good luck!
The good news is SRTY is on a tear.
Good luck!

weatherweenie
TSP Legend
- Reaction score
- 179
Wow! Where's the bottom in AGQ?
coolhand
TSP Legend
- Reaction score
- 530
I'm still seeing "underlying" support at high levels. I'm thinking this is just a short term move lower to allow the big money a chance to "reload". That could change, but that's what I see right now.
The downturn in the S Fund has intensified. Decided to move to cash rather than wait until the S&P follows suit. Hopefully this isn't another short term move down to shake out the weak hands. The last few times we saw this, the market roared back in massive up moves, and I've missed out. That's why my YTD numbers are so low. You may not want to follow my advice.
The good news is SRTY is on a tear.
Good luck!
View attachment 23175
MrJohnRoss
Market Veteran
- Reaction score
- 58
Wow! Where's the bottom in AGQ?
Isn't that the truth! Gold and silver are getting slaughtered! It makes no sense. That's why I'd rather be a buyer here than a seller. In my opinion (whatever that's worth), it has nowhere to go but up. Bring on the capitulation! :blink:
weatherweenie
TSP Legend
- Reaction score
- 179
I'm sitting on a sizable loss, for me. It seems like whenever I throw the towel in, and sell, there's a bounce not too far down the road.Isn't that the truth! Gold and silver are getting slaughtered! It makes no sense. That's why I'd rather be a buyer here than a seller. In my opinion (whatever that's worth), it has nowhere to go but up. Bring on the capitulation! :blink:
MrJohnRoss
Market Veteran
- Reaction score
- 58
I'm sitting on a sizable loss, for me. It seems like whenever I throw the towel in, and sell, there's a bounce not too far down the road.
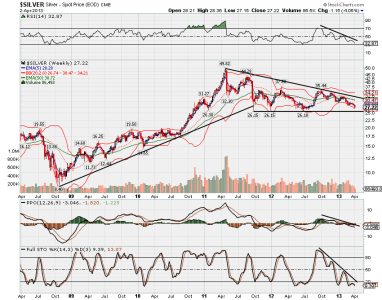
Support for Silver around $26.10. We're at $27.22. We could still go down 4% (that's 8% with AGQ). If I see support there, and a turn around in the indicators, I may load my flatbed trailer with silver bars at those prices. The dollar is a worthless piece of paper, IMHO.
MrJohnRoss
Market Veteran
- Reaction score
- 58
k0nkuzh0n
TSP Pro
- Reaction score
- 27
Support for Silver around $26.10. We're at $27.22. We could still go down 4% (that's 8% with AGQ). If I see support there, and a turn around in the indicators, I may load my flatbed trailer with silver bars at those prices. The dollar is a worthless piece of paper, IMHO.
What is your current outlook on silver?
MrJohnRoss
Market Veteran
- Reaction score
- 58
5 year chart of $Silver. The carnage in gold and silver has been spectacular. I think we will see weeks, maybe months of weakness. Silver could test the $20 area or below (see blue box below). Keep your eyes on the technical indicators. Eventually this trend will change, and it will be a tremendous opportunity.
With every bubble comes opportunity. With every bust comes opportunity. You just have to be willing to go against the flow.
View attachment 23450
With every bubble comes opportunity. With every bust comes opportunity. You just have to be willing to go against the flow.
View attachment 23450
Similar threads
- Replies
- 0
- Views
- 87
- Replies
- 0
- Views
- 152
- Replies
- 0
- Views
- 166

