MrJohnRoss' Account Talk

Are you not announcing your signals anymore? I didn't see anything about going to a sell from your buy at the beginning of April
 
Yes I saw it, hence the question. Signature says 4/17 but you didn't post anything between 4/10 and 4/20. I don't think you can subscribe to signatures
 
Should be interesting I thought about putting on a trade myself, but I'm going to wait for the GDP number to come out. I'm more interested in how the markets react, then actually playing the event, sometimes it's fun just to watch the game from the sidelines. :)
 
Yes I saw it, hence the question. Signature says 4/17 but you didn't post anything between 4/10 and 4/20. I don't think you can subscribe to signatures

My apologies. I usually post my moves, but it's been high pressure hell at work, and had very limited time to get on the board.

My moves this year have been a bust, but I will post them as timely as I can.

Good luck!
 
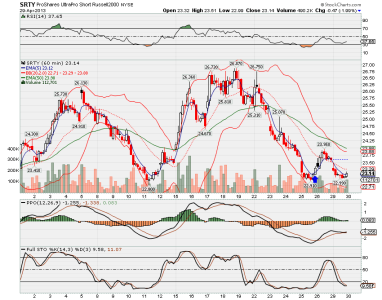
Hourly chart of SRTY:

SRTY.png


Was tempted to sell my SRTY today, but pleasantly surprised to see it hold near my buy price (blue arrow). I don't like selling into weakness unless I'm forced to do so. I'll hold on another day and see what tomorrow brings. Looks like price, and the inicators, are wanting to turn back up at this point. However, if we have another strong day for the markets, I may be forced to capitulate.

Good luck!
 
I'm liking what I'm seeing in the markets today. Come on down, so those of us in cash can buy in at lower prices. Everybody loves a sale. ;)
 
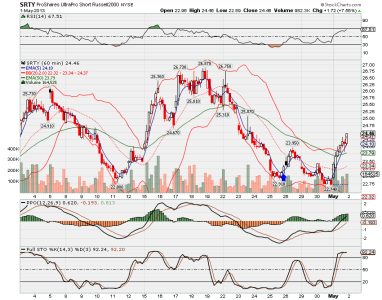
Hourly chart of SRTY:

SRTY.png

With the Dow dropping -139 points (-0.94%), the R2K dropped -2.45% today.

This was good news for holders of SRTY, which was up +7.56%. TZA holders were up +7.10%

Thought about selling at the close, but the daily charts look like a huge candlestick formation to the upside, so I will hold for now.

I'd like to see SRTY hit the upper BB on the daily chart, which is currently around 26.57. That would also coincide with our recent highs a couple of weeks ago near 26.36 - 26.87.

There are no guarantees, of course, but a new month often brings changes in attitudes and changes in market behavior. These first few days in May will say a lot about the rest of the month.

Good luck!
 
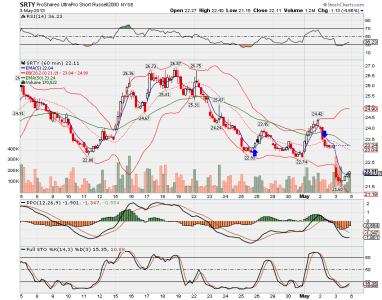
Hourly chart of SRTY. My buy price ~ $23.28.

Just getting a chance to check in... Sold SRTY yesterday at 23.23. Dang it. One of these days the odds will stay in my favor until I make a nice profit. Was not meant to be this time.


SRTY.png


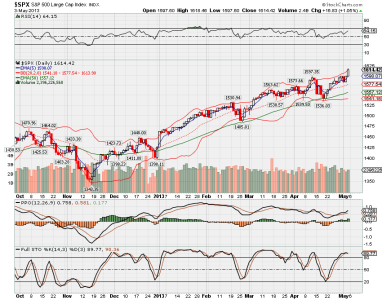
Hoping for a bit of a pullback on Monday. Looks like the market is a little over-extended here, with the S&P bumping up against the upper BB. My system said to get back in last month, but I was out of IFT's, so here I am in cash. Boo.

$spx.png

Good luck!
 
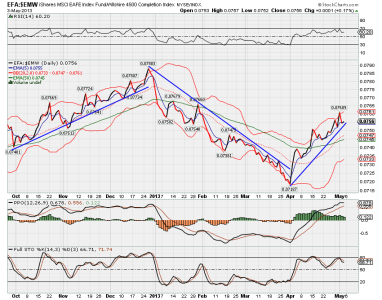
Looking at the relative strength of C, S, or I, it's clear that the I Fund has the upper hand here.

Here's a relative strength chart of the I Fund vs S Fund. Seems pretty obvious to me.

Not coincidentally, the LMBF also switched to the I Fund.


efa$emw.png
 
Just getting a chance to check in... Sold SRTY yesterday at 23.23. Dang it. One of these days the odds will stay in my favor until I make a nice profit. Was not meant to be this time.


Good luck!

It looked good to me at the time too John, but I also recognized (as I'm sure you did) that it was a counter-trend trade is a very upwardly biased market. My last short position was NUGT, which I managed to sell with minimal losses, but that's also a more targeted fund that tends to have a mind of its own. I just haven't been comfortable with the short side for awhile and prefer to trade in the direction of the trend at this time.

I'm not critiquing you in any way. I'm simply providing my personal perspective for general consumption. This is a very tough market for shorts.
 
Completely agree, Jim. This market just does not want to go down, except for a few quick dips at a time, and then BOOM! It looks like the 50 DMA and the bottom BB are solid support areas for bounces to occur. This will undoubtedly change over time, but there's no denying this market strength right now.
 
Looking at the relative strength of C, S, or I, it's clear that the I Fund has the upper hand here.

Here's a relative strength chart of the I Fund vs S Fund. Seems pretty obvious to me.

Not coincidentally, the LMBF also switched to the I Fund.


View attachment 23642

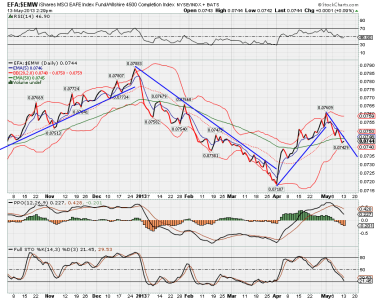
Here's an updated chart comparing the relative performance of the I Fund vs the S Fund:


efa$emw.png


Isn't it amazing how the performance of these funds can turn on a dime? It's also amazing to me how often these turns occur at or near the beginning of each month. It's been proven that if you're walking through your house with a thought in mind, and you walk through a doorway into another room, you often times forget what it was your original thougth was. Going through the doorway gave you a diffent perspective, which altered your thinking. Perhaps this is true with investment vehicles and the changing of the month?

In any event, it should be quite obvious from the above graph that the S Fund is clearly outperforming the I Fund this month. The S Fund is also outperforming the C Fund as well.

I will be patient, and wait for a better opportunity to employ my cash. Even bull markets need an occasional pause to refresh.

Good luck!
 
This market is totally in the clear to move to places not thought of before to the upside. There is no breadth resistance anymore to impede this progress. We will continue to see day after day of positive breadth plurality with maybe a one or two day pause before moving higher again - so feels like a Primary 3rd wave.
 
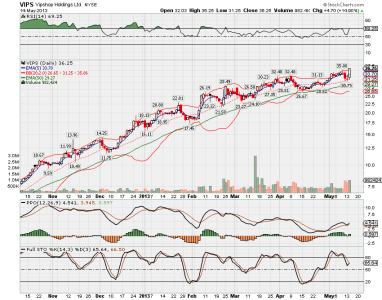
I scaled into VIPS yesterday in my 401k and Roth at an avg price of 32.62. Was pleasantly surprised to see today's closing price.

vips.png
 
Back
Top