It appears to me that momentum is gathering strength for a move lower for the markets. Today the market is up a bit, and I'm using it to move to a 100% cash position. Here's what I see...
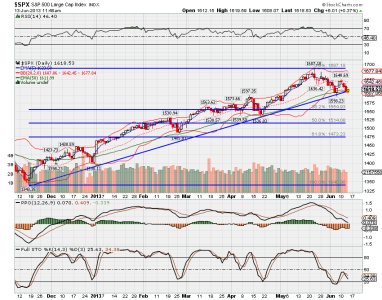
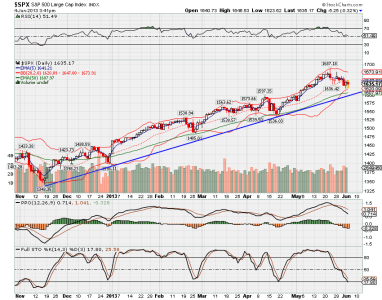
Today's price, the 50 day EMA, the lower BB, and the long uptrend line are all currently being intersected. This is a critical point in the chart, and I might expect a major change could be in the works.
What leads me to believe we may be heading lower from here is three of the indicators that I like to use are all pointing lower: The RSI, the PPO (MACD), and the Stochastic.
1.) RSI, which reached an overbought condition at the recent market high in mid May, has turned decidedly lower, and is making a series of lower highs and lower lows.
2.) PPO had a cross over during the week of May 20th. The downside momentum on this indicator is showing a very negative slope. Take a look at the last time the MACD was below zero. We haven't been there since the market bottomed last November. I suspect the odds are high that we'll go below that zero line in the next few days.
3.) Stochastic tried to go higher during this last market bounce, but it looks like it's going to fail. Stoch is now heading back down, which is not a good sign.
One more item:
4.) The other thing I notice is that the 5 day EMA is sloping lower as well, and making a series of lower highs, and lower lows, which is another warning sign.
There just doesn't appear to me (and my untrained eyes), that there's a lot of good technical evidence to support much of a move higher for the markets right now.
Based on the above, I decided to use my 1st June IFT to move to a 100% cash (G Fund) position. The first Fibb line (38.2%) is at 1555. Perhaps we'll test that in the next few weeks.
Good luck!

