MrJohnRoss' Account Talk

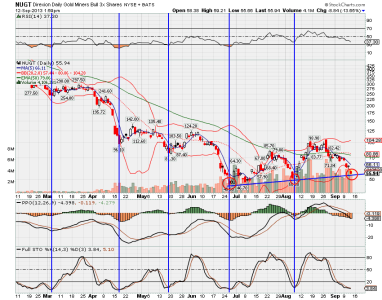
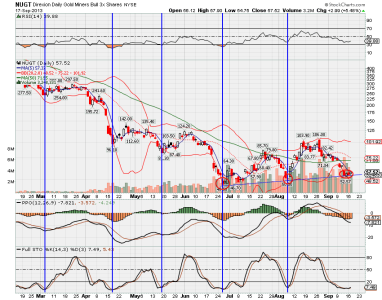
Thanks for posting graph and analysis in post # 2239 below MR. JR. I have been curious about the timing of the highs/lows also. I did a rough sketch with the graph you posted on 9/10/13. Your graph and points are more concise. My question is how do current Market conditions (Fed taper, price of dollar, oil, Syria) factor into the NUGT/DUST equation ?? NUGT has been in a long downtrend all year, from 298 range in March to low of 46 on about June 25 with rallies in between. Avida Capital is calling for 30-40 price on NUGT into Oct., What Market conditions have to change to get NUGT to rally ?? Thanks...
 
Last edited:
Thanks for posting graph and analysis in post # 2239 below MR. JR. I have been curious about the timing of the highs/lows also. I did a rough sketch with the graph you posted on 9/10/13. Your graph and points are more concise. My question is how do current Market conditions (Fed taper, price of dollar, oil, Syria) factor into the NUGT/DUST equation ?? NUGT has been in a long downtrend all year, from 298 range in March to low of 46 on about June 25 with rallies in between. Avida Capital is calling for 30-40 price on NUGT into Oct., What Market conditions have to change to get NUGT to rally ?? Thanks...

Like anything else that is traded, value is placed on what a person is willing to pay for it. Right now the PM's are seeing a downturn, to put it mildly, but it won't last forever. The price of PM's is going to be the driver for NUGT/DUST.

GLD is now hitting it's 50 DMA, and SLV is about 4% away from that level. We may get some price support at this 50 DMA level for the PM's, although downside momentum is pretty steep. We are within the timing band for an intermediate term low, so the odds are increasing that we'll see that low soon. I'll be watching the PM's to see when they stabilize and begin showing support before expecting a rebound for NUGT.

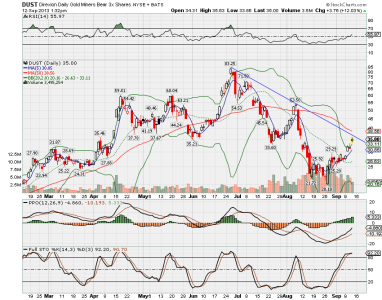
One item of note: This chart of DUST shows a downtrend line that may provide resistance in the very near future.


dust.png
 
Is today the low for NUGT? The following chart makes a good case for "yes".

A word of caution: Don't try to catch a falling knife.


NUGT.png
 
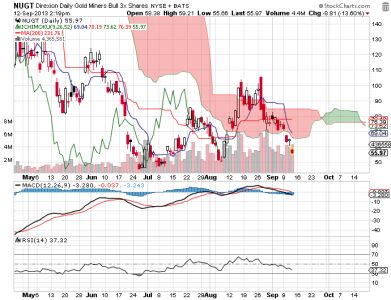
NUGT.png

Price is back below the cloud, which is bearish. Looking at Leading Spans A and B, which give a notional projection of support and resistance levels out 26 trading days, suggests it will bottom soon and turn up modestly (around the 23rd of the month). But this is a very volatile and manipulated market sector, which makes it more challenging to predict. I stopped playing these funds earlier in the year because it's a love-hate relationship. You love the gains when you hit them right, but you hate the losses when you don't. It's obvious why they are so popular, but they are very challenging to trade successfully and consistently.
 
Thanks for your chart and viewpoints CH. Without a doubt, NUGT/DUST is not for the faint of heart, and should only be a portion of your "speculative" portfolio. Risk (and reward) are about as high as you can get.
 
Mr. Cool ... Thanks for posting the cloud diagram. I have been following the posts in your account thread and have been playing around a bit with ... and reading about ... these clouds. I was "this close" to asking you to weigh in on NUGT, but you beat me to the punch. Thanks again!
 
For those of you who don't want to worry about the day to day market fluctuations, this timing model will work very well.

Just keep track of the weekly S&P 500 as follows:

When the 10 week EMA crosses over the 50 week EMA, you want to be long stocks.

When it crosses under, you want to be in the G Fund (or short the market in your IRA's).

Only four trades since 1997.

You can avoid whipsaws by making sure the Stochastics RSI reaches 0.10 or below before selling.

Good luck!


View attachment 24854[/QUOTE
Hello Mr. John Ross... Rcknfrewld had made a comment about liking this strategy and I am going to study it further and play with a few variations on the parameters. This truely is a great chart. Great information with very manageable strategy. Really like the bold lines too ... it is easy to see the entry and exit points.

I am working to see how parameters could be modified just enough to increase the number of plays each year even in market down years while still getting clear entry and exits that would provide some gains. That would mean more market involvement and risk but I don' t think I could sit out too long so i guess i am looking for a little more playtime. Any advice/ suggestions to do further analyses would be very appreciated. Looking to do some charts withn12 or 13 or 15 day EMA crossing over 20, 26, 35 , 40 days...just to see what happens to number of plays per year and gains. Thanks for sharing your charts!! :)
 
Thanks Annie, but I can't take credit for developing the chart. Found it on another website, but thought it was important enough to share it here. It should work really well if all you're looking for is to sidestep the MAJOR bear markets.

You have the right idea for looking for adjustments to the parameters to sidestep smaller downtrends. There are no shortcuts. You have to back test each of your ideas to see if they pan out.

Hope you find just the right combination! Please share your results if/when you find "the magic formula"! ;)

Good luck!
 
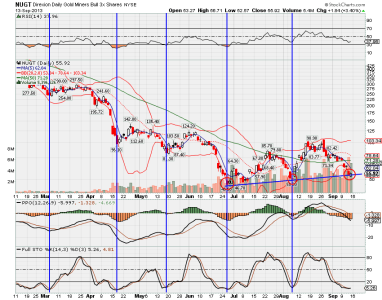
The NUGT/DUST system remains holding DUST. As expected, NUGT had a rebound yesterday, but only a minor one (+3.4%). It would take a much larger move to get the model to switch, so we'll wait patiently to avoid a possible whipsaw.

Looking at the chart, it seems likely that a switch may occur this coming week, as the possible timing band and support line appear to be converging at this point. It's been a nice run for DUST, as the move from 8/28 (26.96) through yesterday's close (34.93) is a +29.6% gain in a little over two weeks! Hoping that the next switch will provide just as nice an opportunity for NUGT! (Repeat after me: Volatility is GOOD!) :laugh:


NUGT.png
 
Just now able to get onto the forum. Computers at work blocked me from accessing this site because of a suspected trojan, or malware at the tsptalk address. Hope it gets resolved soon...
 
Markets seemed to be a little "toppy" today. Many of the stocks I look at started out strong, but finished very weak. Not a good sign. Keeping my eyes peeled for a possible reversal.
 
The NUGT/DUST system continues to hold DUST, although we seem to be right at the precipice of a change in direction. Perhaps we'll see a reversal in the coming days. Wouldn't be surprised to see some churning in this price area without a lot of direction until it decides which way it wants to go. Stay tuned...
 
Thanks for the system update! I was wondering if it was getting close to a flip to NUGT.

Any thoughts on how a Fed decision to cutback on QE will impact NUGT/DUST?
 
This system you speak of peaks my interest...are there posted rules for said system or a way to track the flips...how does it work? :D
 
WhoDey.....Thanks for the system update! I was wondering if it was getting close to a flip to NUGT.

Any thoughts on how a Fed decision to cutback on QE will impact NUGT/DUST?
NUGT seems to have stabilized a bit. Currently 56.30 up 3.5%. Sure hope we're finding a bottom here. I'm thinking that as Federal budget/debt ceiling deadlines near and Congress continues to bicker that will be the catalyst for NUGT to take off..
 
Update on post #2255 below. NUGT up 5.48% today even as GLD sank, curious.. Maybe these ETF's have decoupled based on technicals ? NUGT had strong close and is still up after hours. Saw comments on Marketwatch.com that there may be profit taking tomorrow? I'm curious to see if Mr. JR System will continue to hold DUST tomorrow..
 
Last edited:
For those of you who don't want to worry about the day to day market fluctuations, this timing model will work very well.

Just keep track of the weekly S&P 500 as follows:

When the 10 week EMA crosses over the 50 week EMA, you want to be long stocks.

When it crosses under, you want to be in the G Fund (or short the market in your IRA's).

Only four trades since 1997.

You can avoid whipsaws by making sure the Stochastics RSI reaches 0.10 or below before selling.

Good luck!


View attachment 24854

Would you please explain the meaning of the StochRSI being below 0.1 when considering selling, and why did you set the StochRSI parameter at 92? What does that mean? I noticed the default setting is 14 but I haven't found yet what any of that means....really appreciate the help!
 
NUGT/DUST looks like it just barely produced a switch at the end of the day to NUGT. Since I can no longer post from work (my work computers still think this site is contaminated with MALWARE and a TROJAN VIRUS), technically, it now holds NUGT. For those of you paper trading this system, if there is ANY upside at the open tomorrow for NUGT, that would be the time to get in. (If it's a negative day for NUGT, I would hold off on making the switch). I find it amazing that the uptrend line and the timing band coincided almost perfectly to the day to produce this signal. Now let's see if it pans out, and if it does, how long it will last...


NUGT.png
 
Would you please explain the meaning of the StochRSI being below 0.1 when considering selling, and why did you set the StochRSI parameter at 92? What does that mean? I noticed the default setting is 14 but I haven't found yet what any of that means....really appreciate the help!

With Stockcharts, you can adjust the parameters on any of the indicators to suit your trading style. The default setting of 14 doesn't provide any meaningful signals for this model, however, a setting of 92 provides the rare confirmation that a bear market is in full swing (along with the crossing of the 10 and 50 week exponential moving averages). The SRSI level of 0.10 is just a visual way to avoid whipsaws.
 
Back
Top