MrJohnRoss' Account Talk

WhoDey....I appreciate the conversation regarding NUGT/DUST. I have yet to trade these, but have been keeping an eye lately on NUGT.


I've been trying to learn that bit of wisdom! It looks like NUGT is drawing close to offering an entry point, but patience is still required IMO.

Dutchy ... I've locked in more than my fair share of losses this year, so I feel the pain. I think I'd be inclined to hold a bit longer, but that's easy for me to say. Good luck.

Thanks Who Dey.... NUGT down another 8% this morning, bounced off 65 area so far. Avida Capital called for 60's this week which hit this morning. Scary thing is, they call NUGT 30-40 range end of 2013 with small rallys between.. Not good. Should have cashed out @ 85 last week but was on the road, oh well.. Only can hold and pray now.
 
The NUGT/DUST system is still holding DUST, but the big run-up today in DUST could cause a short term profit session soon, as we are now hitting the upper BB.

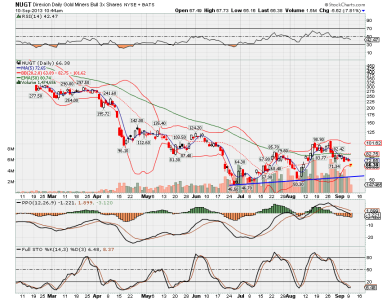
Dutchy, here's a chart of NUGT for you. It's looking weak, as the big money is flowing to equities, not the precious metals market or miners right now. The good news is that it's nearing the lower BB, so that may act as some support. Eventually however, we may hit that lower trend line (55 area) before seeing a full up rally again. Unfortunately, it's going to take some time to get there and start another uptrend. Possibly later this month?


NUGT.png
 
Thank you Mr. JR. Great graph below and thank you for your analysis. I'll just have to hold "till hell freezes over" if it takes that long. Patience over locking in a 35% loss. I see NUGT was at 50.30 as recently as 8/5/13 area, only a month ago. But, conditions have changed and I don't suppose there is much chance of NUGT hitting 85-90 area again soon? Live and learn!
 
Last edited:
JR's graph shows the lower trend line ... but if NUGT is in an ascending channel, an upper trend line indicates a nice upper target.

Of course, I can squint my eyes and turn the page just so and convince myself of most anything! Hopefully that lower trend line holds.
 
Interesting to note that one of my timing systems fired off a fresh buy signal yesterday.

If there's one thing I've learned, it's that you can't hold on to the same system forever. Times change. Markets change. And (hopefully) your learning curve causes you to change your thinking....

:rolleyes:
 
If there's one thing I've learned, it's that you can't hold on to the same system forever. Times change. Markets change. And (hopefully) your learning curve causes you to change your thinking....
Just don't wait too long to change your thinking or you end up a day late and a dollar short. Or in my case, a system late and many dollars short. :o
 
So one of the things I've decided to do to improve my stock picking success is the following:

1. I'm going to use the technical ranking only in the top 90th percentile and above for selecting a stock as a buy candidate (based on Stock Chart's data).

2. I'm going to look at three groups of stocks: Large Caps (S&P 500), Mid Caps (S&P400), and Small Caps (S&P 600), each group only looking at the 90th percentile and above.

3. I'm going to review the chart patterns of top 35-40 stocks in each of those three groups (approx 110-120 stocks).

4. Based on those chart patterns, I'm going to throw out stocks that are technically over-extended or don't appeal to me for other chart pattern reasons.

5. I'm going to look for stocks that had recent pull-backs, with the following technical features: fallen Stoch, low RSI, and fallen PPO.

6. I'm going to select a few of the above stocks that are now providing evidence of turning around and producing fresh buy signals (Stoch crossover, PPO crossover, climbing RSI and moving averages, etc.).

7. I'm going to commit my own capital to the selections I make, to ensure that the above rules help me solidify my thinking, and to help me see any errors in this method.

I believe that by using the above criteria, my probability of success in trading should increase.

Wish me luck.
 
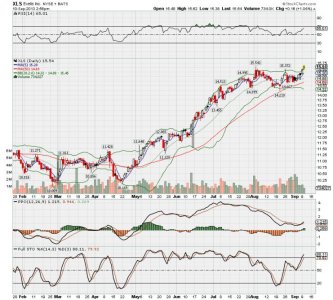
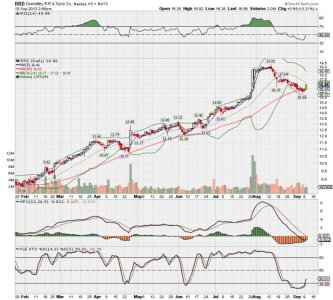
The first two stocks that I chose based on the criteria I just laid out below are XLS and RRD. Charts are below for your consideration.

XLS was purchased yesterday. RRD was purchased this morning.


XLS.jpg

RRD.jpg
 
WhoDey....JR's graph shows the lower trend line ... but if NUGT is in an ascending channel, an upper trend line indicates a nice upper target.

Of course, I can squint my eyes and turn the page just so and convince myself of most anything! Hopefully that lower trend line holds.

NUGT down 12% at 63 today, yuck... Sure hope of hope we bounce real soon! Looking at 40% loss for this trade. I know patience, patience, just wait for the rotation back to NUGT.
 
Last edited:
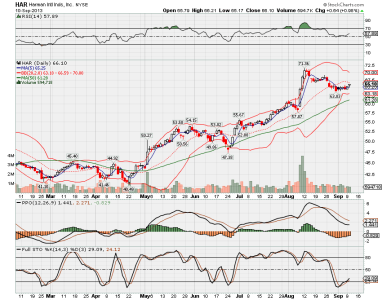
Looking at stocks that fit my screening criteria, another one is looking like a possible buy tomorrow morning. Take a look at the chart for HAR below:


HAR.png

This stock has a large cap technical rank of 97.9, the Stoch has fallen dramatically, and is now crossing the 20 threshold, the PPO looks like it's just starting to head higher, and the RSI, which was in overbought territory not long ago, now sits at 58. If HAR has any upward bias tomorrow, I'm very likely to pull the trigger.
 
I rely on my Mindylou for stock selections - her feline intuition is nearly purrfect. My buy list has been tweeked and now I'm just waiting on margin for money.
 
Hi John.. Wishing you the best on your new strategy!! :)

Thanks Annie! Anything to help me increase my odds of success, right? I printed out my 7 rules/steps, and plan to look at them each time I get ready to make a trade. That *should* keep me from later asking myself... "why did I buy this dang stock???"
:toung:
 
I rely on my Mindylou for stock selections - her feline intuition is nearly purrfect. My buy list has been tweeked and now I'm just waiting on margin for money.

Good strategy, BT! ;) Haha, jk.

Be sure to feed her plenty of raw fish... I heard fish oils are good for kitty brains. Meoww!
 
The NUGT/DUST system will continue to hold DUST, even though it looks like it's going to be a minor down day for the system today. Not surprised to see a negative day after yesterday's big gap higher.

GLD, SLV, $HUI, GDX, AND GDXJ all continue to look weak. Can't wait for the tides to turn so I can ride the waves again.
 
MrJohnRoss...The NUGT/DUST system will continue to hold DUST, even though it looks like it's going to be a minor down day for the system today. Not surprised to see a negative day after yesterday's big gap higher.

GLD, SLV, $HUI, GDX, AND GDXJ all continue to look weak. Can't wait for the tides to turn so I can ride the waves again.
Thanks for the update Mr. JR... I stayed away from the computer today having things to do and being reluctant to look after yesterday's big down day for NUGT. Seems today was just a dead cat bounce ? I was hoping that NUGT had hit a bottom and may bounce from here.. I'll continue to hold NUGT and try to get in snyc., wiith your system...
 
Last edited:
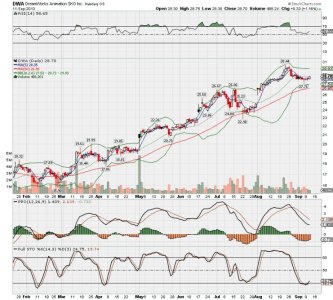
Here's another selection based on my previous buy criteria: DreamWorks Animation (DWA):

This stock was selected for all the reasons I've outlined previously.

Although I would have liked to see it get a little closer to the 50 DMA, it looks like it's wanting to curl back up, so now may be a good entry point.

If we get a positive move tomorrow morning, I may pull the trigger on this one as well.

DWA.jpg
 
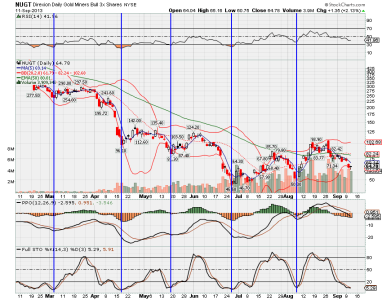
Timing Bands for NUGT:

This is a good way to predict when a turning point in the NUGT/DUST system may take place.

I drew in vertical lines on the chart of NUGT to point out the intermediate term low points.


NUGT.png

I then determined the dates of these low points as follows:

Mar 5
April 17
May 17
June 26
Aug 7

This led me to calculate the number of (calendar) days between the above dates, which are as follows:

43
30
40
42

The average of these "timing band" periods for a low point in NUGT (based on only this recent small sample) is 39 days.

So, where are we now? The most recent low was on Aug 7. Current date is Sep 11, which is 35 days.

That would mean we are due for an average low for NUGT in four days, which would be Sept 15. Obviously that won't happen (the 15th is a Sunday), but it should give a rough estimate on when we might expect a turning point in our NUGT/DUST system.

Keep in mind that the above small sample has a fairly high delta, or standard deviation, for those of you math geeks. The range is a low of 30 days, and a high of 43 days.

I think it will be interesting to see how it plays out.

:)
 
Interesting chart. I was watching NUGT closely yesterday and when it looked like the day was going to end with a hammer candlestick pattern, I was close to making a trade. Rather than trying to time an exact bottom, I'll probably look to making partial buys and ease into a position.

Not all my indicators were met, however, so I decided to wait and see what today would bring. With pre-market trading showing a down move, it looks like that was a good call, but things could/can change quickly.

As you said, it will be interesting to watch how this plays out.
 
Back
Top