coolhand's Account Talk

Re: Market Snaps Back - Posted by Coolhand

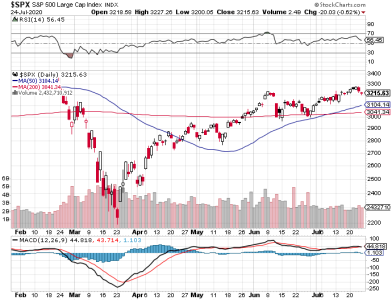
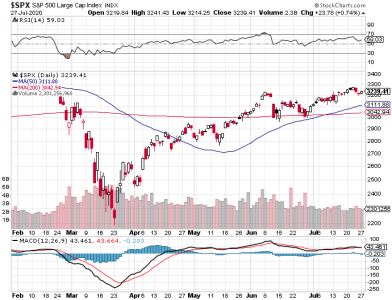
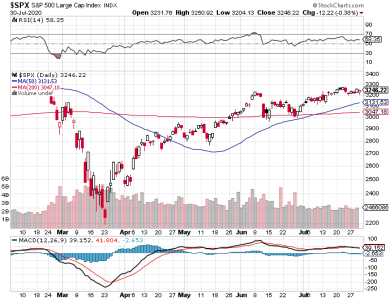
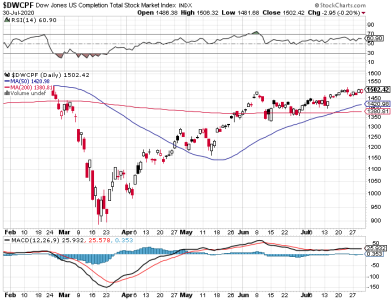
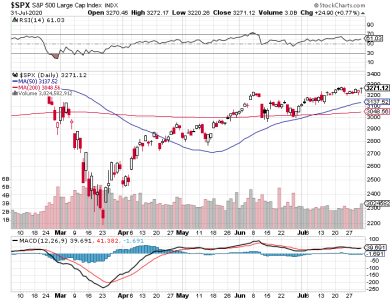
Today's pullback was not unusual. The market had advanced enough over the past few trading days to expect one.
S&P 500.png
DWCPF.png

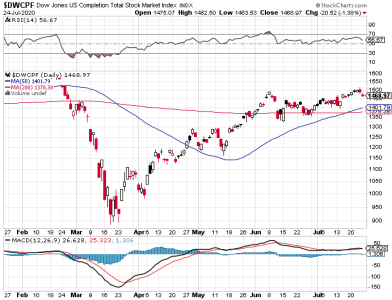
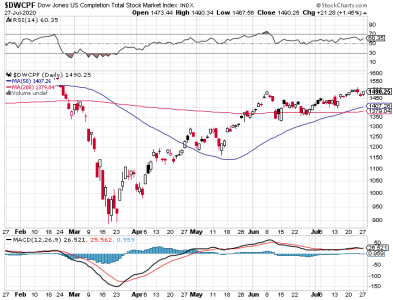
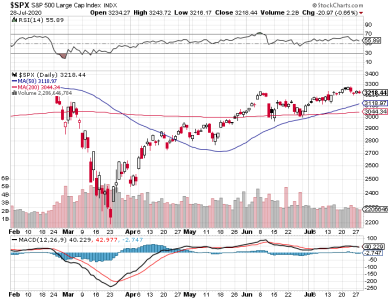
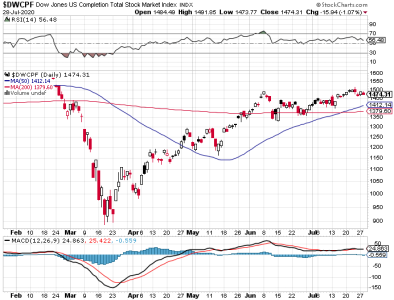
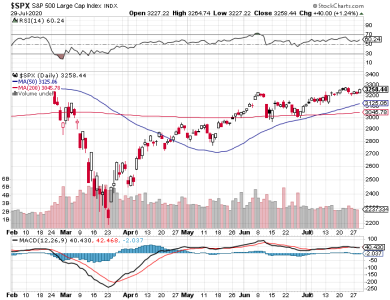
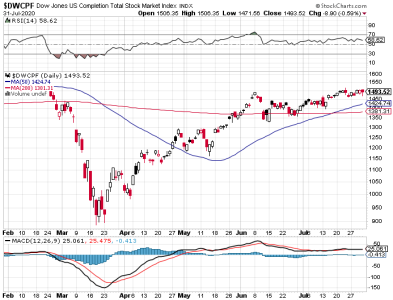
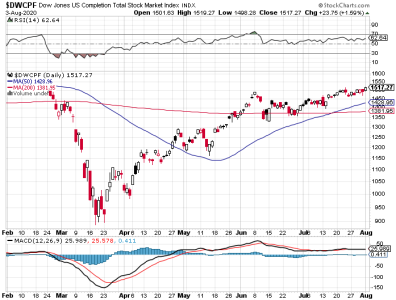
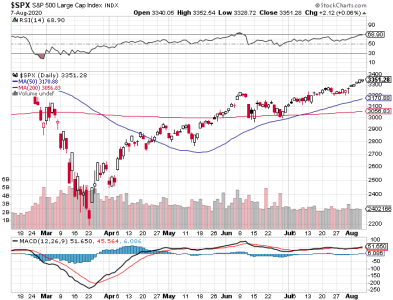
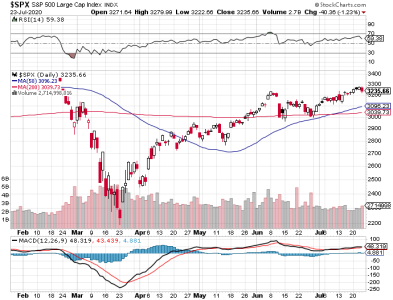
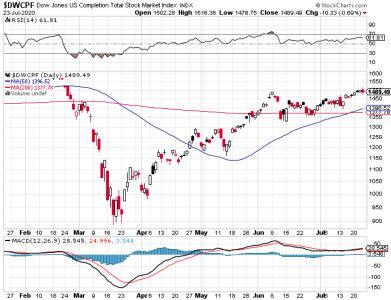
It appears that price is testing support at the February peak (was resistance) on the S&P 500. The DWCPF had not established itself above the February peak for very long, so I would not call it support yet. I will say that the DWCPF held up better than the S&P today, so that's a bullish aspect for today's trading action.
NYAD.png

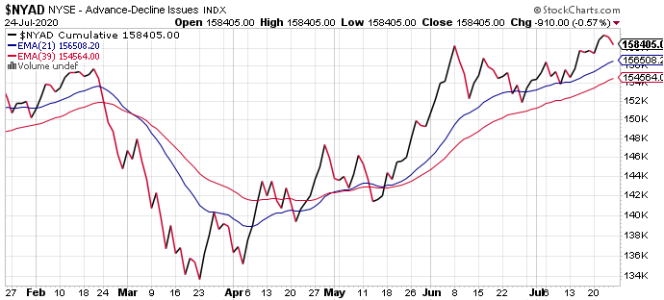
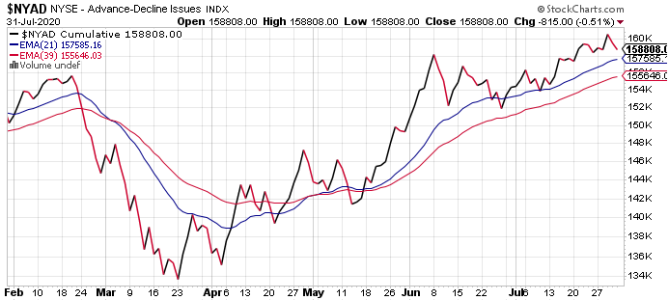
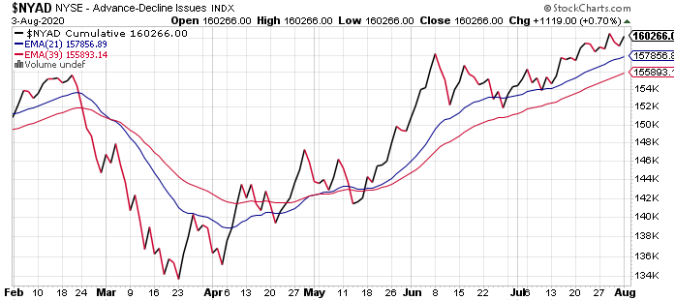
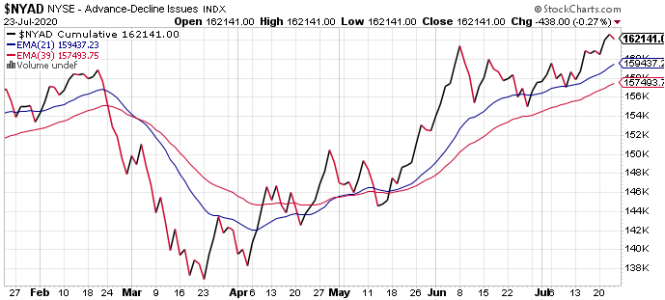
Breadth dipped, but remains bullish.

NAAIM came in a bit more bullish this week. Aside from anticipated pullbacks here and there, I continue to expect price to bias to the upside.

I remain bullish.
 
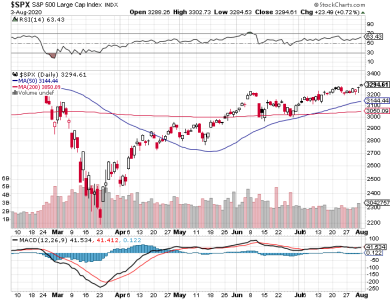
The week started off well enough as the market began to add to gains from the previous week, but the bears sent the market lower at the end of the week. The S&P and DWCPF both closed out with a modest weekly loss overall.

S&P 500.png
DWCPF.png

Still, the charts remain bullish. No market goes straight up and we do have a bias higher over the intermediate to longer term.

NYAD.png

Breadth has turned down, but does remain bullish.

The bullish NAAIM reading does not generally give quick gratification. I use it to get a sense of weekly expectations. With the smart money bullish, I expect the upward trend to continue. TSP Talk remains bullish as well.

I continue to remain bullish.
 
The bulls began the new week by erasing some of the losses from late last week.

S&P 500.png
DWCPF.png

So, price is trying to retake the June high again. Aside from the sometimes up/down nature of the market, the indicators continue to point to an overall bias to the upside. Breadth ticked higher today and remains bullish.

I remain bullish.
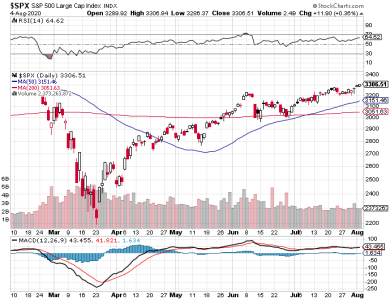
 
The way things are going, a fresh all-time high on the S&P may take till Christmas. Yes, we are biasing higher, but it's like watching the grass grow.

S&P 500.png
DWCPF.png

Price continues to test support at the June peak.

Breadth dipped, but remains bullish and we know that the smart money is bullish.

I'd like to see the bulls take more control, but the indicators still point higher.
 
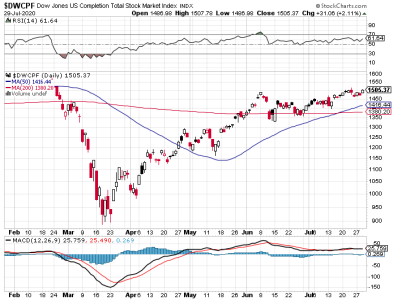
The bulls posted some pretty good gains today. In fact, the DWCPF was up over 2%.

S&P 500.png
DWCPF.png

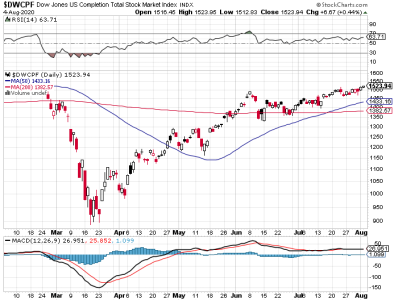
That index (DWCPF) saw price close just above its previous closing high by just a hair. The S&P is not far from its own high. But momentum is largely flat and that's why price seems to be moving in a sideways fashion.

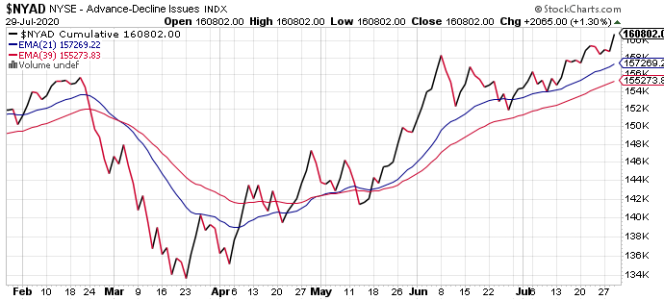
NYAD.png

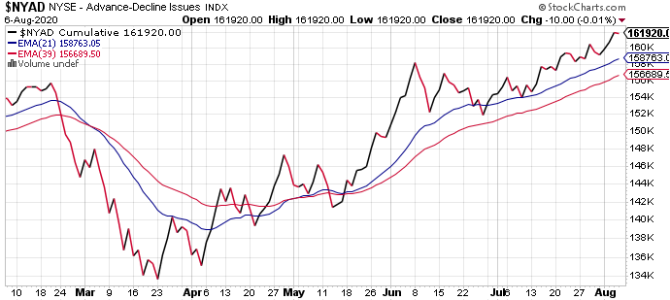
Breadth posted a fresh high and remains bullish.

NAAIM reports tomorrow. I remain bullish.
 
Re: Smart Money Gets Bullish

The latest NAAIM reading was largely unchanged, but I did note that what little shorting was going on among this smart money was reduced again. In other words, these money managers expect higher prices (eventually).

Today's action was just more of the slug-fest we've come to expect between the bulls and bears. Let's see how the market ends the day as we may have bottomed (today).
 
Re: Smart Money Gets Bullish

The bears jumped on the market at the open, gapping price lower after the opening bell. But they couldn't press the downside as the bulls were able to begin recovering the market after about an hour of trading.

S&P 500.png
DWCPF.png

And while the bulls weren't able to get the indexes into the green, they didn't close it all that far below the neutral line either (resilience).

Breadth dipped, but remains bullish.

The latest sentiment reading from NAAIM showed little change (bullish), but I did note that the bears among them reduced their short exposure. This group is very bullish overall.

The upside bias remains, but the back and forth battle for control of market direction continues. The smart money says the bulls will continue to win that battle (eventually).
 
Re: Smart Money Gets Bullish

We got another shoot out today, with the bears once again striking early, but the bulls countering later in the trading session to send price back near the neutral line (mixed).

S&P 500.png
DWCPF.png

The market is in a range around the June high. Momentum is flat.

NYAD.png

Breadth dipped again and you can see that this chart is ragged, but biased higher (and bullish).

So, the action is not inspiring to bulls or bears, but the bulls are showing a lot of resilience. And as we saw with the latest NAAIM reading yesterday, the smart money expects the bulls to eventually win and march price higher.

I remain bullish.
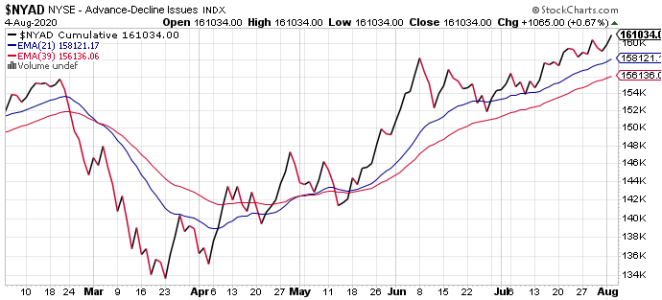
 
Just learning how to read these charts. Do these indicate that the MA(50) are "support lines" for the current Dow and S&P 500 - indicating that they are likely to remain above those lines for the near future?
 
Just learning how to read these charts. Do these indicate that the MA(50) are "support lines" for the current Dow and S&P 500 - indicating that they are likely to remain above those lines for the near future?

The lines are just points of reference. The 50 and 200 day moving averages are among the most common. They can be either support or resistance depending on whether price is above or below them. It helps determine the trend as well. Other averages can also be used depending on what time frame a trader is interested in. TSP does not lend itself to short term trading (generally speaking), which is why I use the longer averages.
 
The bulls came out swinging today, as price gapped higher and stayed elevated throughout the trading day.

S&P 500.png
DWCPF.png

The charts are sporting fresh highs on a bit more volume.

NYAD.png

Breadth remains bullish.

It hasn't been a rocket ride, but NAAIM's bullishness has been correct as far as the market is concerned.

I remain bullish.
 
Hi Flalaw97, I love reading this TradingSim site as it contains tons of info. You can click on lessons 3, 5 and 8 for Moving Averages under Technical Overlays. But there is so much more...if you click at top on Technical Analysis, you will see a whole other realm! :smile: It can be a bit overwhelming to see this much stuff. But you can bookmark it and read when you like. This site is one of my favorite resources. Best Wishes! :D:D:D.

https://tradingsim.com/blog/category/technical-analysis/overlay-indicators/.

Also, love Stockcharts.com Chart School.
https://school.stockcharts.com/doku.php


The lines are just points of reference. The 50 and 200 day moving averages are among the most common. They can be either support or resistance depending on whether price is above or below them. It helps determine the trend as well. Other averages can also be used depending on what time frame a trader is interested in. TSP does not lend itself to short term trading (generally speaking), which is why I use the longer averages.
 
Last edited:
We got more up/down action today, but the bulls closed out the session near or at the high of day.

S&P 500.png
DWCPF.png

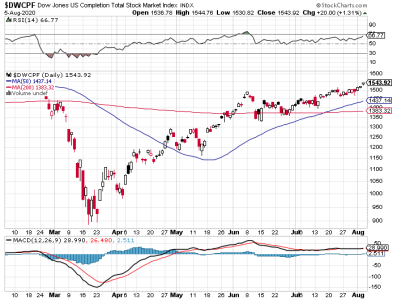
Price posted fresh highs again. For reference, the peak on the S&P is still about 100 points higher.

NYAD.png

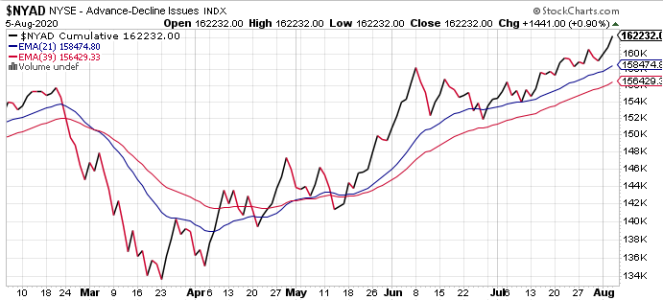
Breadth hit a fresh high as well and remains bullish.

I remain bullish.
 
Re: Smart Money Gets Bullish

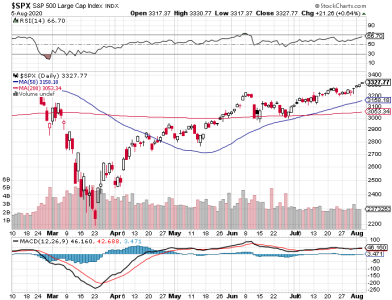
The bulls continued their win streak today (4 in a row).

S&P 500.png
DWCPF.png

The sideways action we experienced not long ago is fading away as price continued to post fresh highs on the current uptrend.

NYAD.png

Breadth continues to look very good.

NAAIM report tomorrow.

I remain bullish.
 
Re: Smart Money Gets Bullish

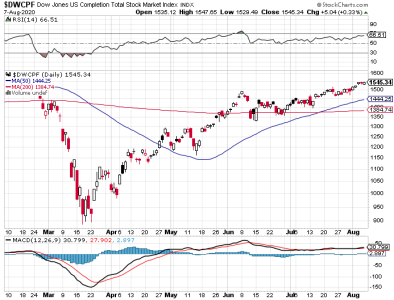
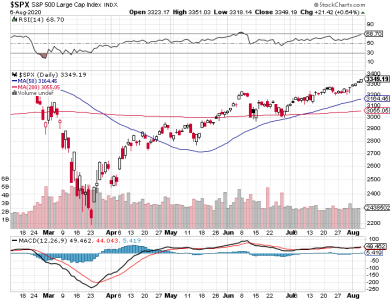
We got a mixed day of action today as the S&P 500 made it 5 up days in a row, but the DWCPF closed modestly lower.

S&P 500.png
DWCPF.png

The charts remain decidedly bullish. RSI is getting close to overbought, but that's not a big concern with the smart money being bullish.

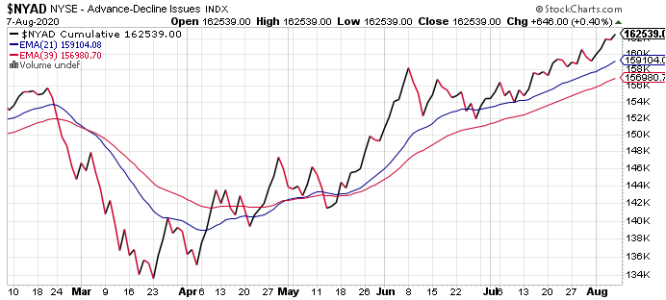
NYAD.png

Breadth dipped just a bit and remains bullish.

NAAIM was relatively unchanged today and remains solidly bullish.

I don't mention precious metals often, but I follow them closely and they are on tear; especially silver. I am convinced that that train is just getting started too.

I remain bullish.
 
Re: Smart Money Gets Bullish

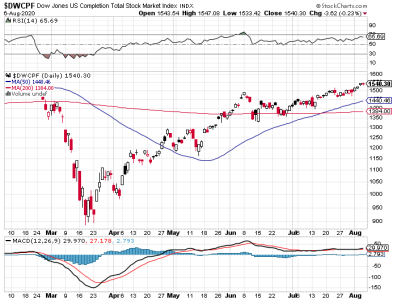
The bulls posted significant gains last week.

S&P 500.png
DWCPF.png

We can see that price is slowly rising along with the 50 and 200 day moving averages. The long term trend is up.

NYAD.png

Breadth hit a fresh high on Friday and remains bullish.

We are heading into a new week with the smart money still bullish after last Thursday's latest sentiment reading. TSP Talk remains bullish, but I noted some shifted to a more neutral stance.

After last week's gains, it would not be a surprise if the market sees some degree of a pullback soon. But the trend does remain up and the smart money is in the bullish camp. I remain bullish.
 
Back
Top