Bear Cave 2 (Bull Allowed)

Take-a-bow-Jay

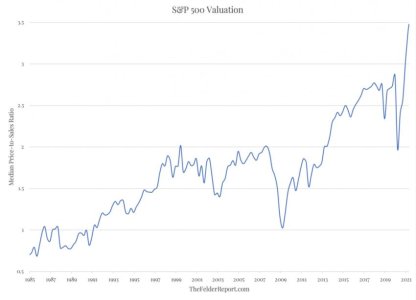
All that can be said about all of this is, ‘Congrats, Jay! You’ve officially blown the biggest stock market bubble in history.’ In all seriousness, however, there will undoubtedly come a time when concerns regarding financial stability will outweigh those regarding too-low inflation. Policies inspired by the latter may even precipitate the shift to the former. As a wise trader once said, “nothing like price to change sentiment.” For the moment, though, investors would appear to be applauding Jerome Powell’s historic accomplishment.

https://thefelderreport.com/2021/05/05/take-a-bow-jay-pow/
 

Attachments

  • a.jpg
    a.jpg
    27.8 KB · Views: 72
May and June are normally "outflow" months

Looking back at the last 25 years, May is the first month of the year that registered net outflows. In 2021, Q1 and April followed this money flow pattern. There has been +$602B worth of equity inflows over the last 150 trading days starting on November 1st 2020 (day of the election and positive vaccine news). This is +$4 Billion worth of equity demand, per day, everyday.
https://themarketear.com/
 

Attachments

  • a.png
    a.png
    64.8 KB · Views: 68
SPX daily: Day 2 of the close below the 5 and 10 dma..... Waiting for Mr Market to show its hand, and my trading system remains in a cash position. A sideways move for 14 days now since the SPX printed the 4191.31 marker. It closed below it again today.... Topping or getting ready for the next move???? Good luck if you are trying to figure that out. I wait!
 

Attachments

  • a.jpg
    a.jpg
    67.8 KB · Views: 68
TLT daily: TLT continues to make higher lows, and remains above the 5, 10, 20 and 50 dma. TLT is an index you should track - because it is an important tell at times.... Used as a flight to safety! Go away in May for some I would guess.....
 

Attachments

  • a.jpg
    a.jpg
    58.6 KB · Views: 68
Bears - remain in hibernation
Latest AAII bearish readings show bears have stayed at rather low levels. Given the latest move in some of the "sensitive" tech stuff, you could have expected a few more bears to revive. Is this the set up, no bears, just in time for a bigger move lower?
https://themarketear.com/
 

Attachments

  • a.jpg
    a.jpg
    79.2 KB · Views: 59
SPX daily: A nice close above the 5 and 10 dma....... 15 days of this sideways move.... Next up could be another test of the all time high! We shall see how this compression plays out, and if the first move is the correct one..... Up or down!
 

Attachments

  • a.jpg
    a.jpg
    57.8 KB · Views: 67
The easy money trade is in play. You buy Thursday’s close and sell Monday’s close. A pattern that keeps on giving until it doesn’t.

I posted my daily SPX chart above....
 
SPY daily: Another all time high and a tag of the upper BB...... Breakout of fakeout? LOL..... sorry, but I don't guess anymore. I just trade the trend and it remains up .

Trade what is happening not what you think will happen. Leave the Bias for other traders.
 

Attachments

  • a.jpg
    a.jpg
    62.9 KB · Views: 56
USD weekly: Another higher low? We shall see how next week plays out. A cycle low "COULD" be close.....
 

Attachments

  • a.jpg
    a.jpg
    54.9 KB · Views: 60
SPY/TLT/GLD/GDXJ ratio chart: Look what happened to GDXJ, TLT, and the USD when stocks sell off. Waiting to see how this ratio plays out "IF" the SPY ever sells off again. Note where the flight to safety funds go when investors get really scared...... Also note what GDXJ did (GDXJ is the gold line) That is the reason I track this data. I like to trade GDXJ.
 

Attachments

  • a.jpg
    a.jpg
    73.8 KB · Views: 67
Last edited:
GDXJ daily: A tag of the upper BB has indicated ST weakness in the days ahead based on the current pattern. We shall see how next week plays out. I reduced my position size today. Maybe this time we get the big move the Bugs are always talking about. I trade GDXJ because the patterns have been fairly easy to trade, and for NO other reason. I own NO gold..... Keep in mind I'm a trader not an investor.
 

Attachments

  • a.jpg
    a.jpg
    94.5 KB · Views: 69
SPY/SDS chart: I trade SDS because it's very liquid..... Just a penny between the bid and ask price.
 

Attachments

  • a.jpg
    a.jpg
    98.4 KB · Views: 67
VIX weekly: Smashed back down..... NO FEAR! Just BTFD..... I still think a move back up to the upper BB is getting very close, but I don't trade what I think. I trade what I see and the trend remains up. I might buy a small position of VXX as a hedge going into next week. For now it should be easy money Monday unless traders go away in May.
 

Attachments

  • a.jpg
    a.jpg
    100.6 KB · Views: 65
VXX 2 hour chart: I just took a Beer Money position using VXX. I know, "It's easy Money Monday" up next. That is why it's only a small position.... No stop since it's such a small position. You can see the pattern I'm playing...... NO more then a single Blackjack hand, and I like the odds - win, lose or draw! On the daily the SPY continues on its uptrend.....

05/07/2021 17:19:5 Bought 25 VXX @ 36.74
 

Attachments

  • a.jpg
    a.jpg
    61 KB · Views: 65
Last edited:
Fed - tech's best friend
Fed has continued to "feed" the system, and the main beneficiary is the FAAMG space (if FAAMG was a country its GDP would be the 3rd in the world).

On the other hand as Bofa notes, there are possible negatives going forward;

"...bad news is global tapering has begun (big 4 QE set to fall from $8.5tn in ‘20 to $3.4tn in ‘21 to $0.4tn in ’22) and in Q2/Q3 the stronger the macro the quicker & bigger the taper".

Fed has definitely managed fueling the tech space, but they have been unable to manage tech volatility.

VXN remains elevated, despite the BS printing new highs...

https://themarketear.com/

Eric marienthal - Blue water

https://www.youtube.com/watch?v=XzgD5E_paEQ&list=PL216y6019lWH9eAnA_y6ffkpA7cEilGHd&index=19
 

Attachments

  • a.jpg
    a.jpg
    65.6 KB · Views: 71
Well, you know what I say..... We shall see!

USD daily:

Dollar Endgame
by likesmoneystudies

Breaking below the previous daily cycle low forms a failed daily cycle and extends the intermediate cycle decline. Friday being only day 6 indicates that the dollar can trend lower for the next 3 to 6 weeks before printing its DCL. The dollar is in a daily downtrend and will remain so unless it can close back above the upper daily cycle band.

I believe that Friday's failed daily cycle has big. implications for the dollar. In my special report, Dollar Endgame, I discuss how this failed daily cycle is setting the stage for a failed weekly cycle and what this means for the yearly cycle, 3 year cycle and the 15 year super cycle.

https://likesmoneycycletrading.wordpress.com/2021/05/08/dollar-endgame/
 

Attachments

  • a.png
    a.png
    88.4 KB · Views: 61
USD daily tracking data: The USD does remains in a downtrend. We shall if it makes a higher low, or the cycle dude is correct.
 

Attachments

  • a.jpg
    a.jpg
    59.2 KB · Views: 63
USD daily: A close look for those that track the dollar. We shall see if the 89.68 marker holds.....
 

Attachments

  • a.jpg
    a.jpg
    51.2 KB · Views: 69
Back
Top