Bear Cave 2 (Bull Allowed)

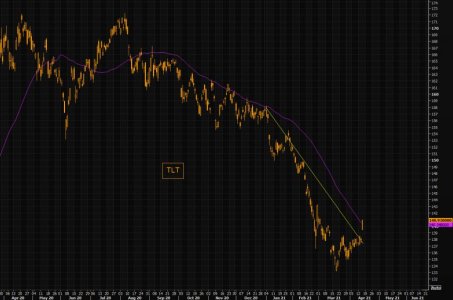
TLT - I guess this answers my upper BB tag..... A possible short squeeze......


TLT - furious short squeeze creating huge p/l pain

TLT is putting in a huge gap to the upside as yields are collapsing.

In our post, TLT group think?, on April 8, we warned our readers that the TLT was a way too big consensus short and was setting up for a violent move higher, we wrote;

"People have switched from seeing rates lower for longer, to seeing them higher for longer.

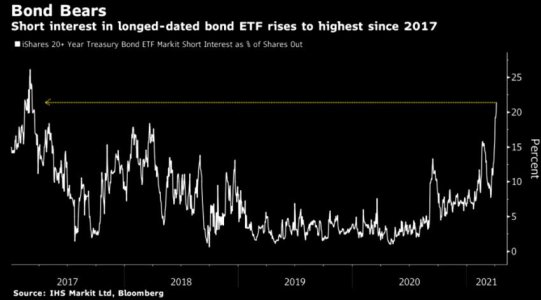
Second chart shows the extreme TLT short...which could be a catalyst to take it above the trend line..."

We suggested to play the upside via options;

"TLT "VIX"; VXTLT, is down since "panic" levels in late Feb. It is not dirt cheap, but offers relatively interesting upside plays..."

Here we are putting in a massive candle to the upside. Depending on how you picked your upside strikes, be sure to roll them dynamically for max "juice". These types of break outs are best managed when you actively roll strikes and manage your p/l.

TLT looks to be closing above the 50 day by the biggest margin since forever.

Second chart is just a reminder from our early April post about the huge TLT short.

This move is killing a lot of p/l today.
https://themarketear.com/
 

Attachments

  • a.jpg
    a.jpg
    60.3 KB · Views: 105
Time to get bullish?
The "easy" trade is over (probably). As BofA notes, the bull move since March 2020 lows is the third biggest jump in US stock prices in 100 years.

Do you chase it here, or plan for something else?
https://themarketear.com/
 

Attachments

  • a.png
    a.png
    51.9 KB · Views: 91
Sell in May or buy the dip?


Is there an elevated risk of a correction? Yes, but buy the dip...

Mislav, head honcho of equity strategy at JPM is examining the risk for a correction in equities, and what to do if/when it happens.

"The potential for a correction is mechanically greater, and we are now only 4-5% away from our-year end targets. We haven’t seen a 5-10% correction for a while, since October. Some technical and sentiment indicators are becoming stretched. RSIs are overbought and Bull-Bear is at highs. When equity betas of US mutual funds peak, as might be the case currently, equities tended to be lower over the next 1 and 3 months. Further, Gold-Copper ratio has moved down to the bottom of the 10-year range, suggesting that this “Safety vs Cyclicality” gauge is showing complacency, which was historically followed by weaker equity performance. Finally, we are approaching May, which was typically not a great time to be long".

So far, sounds like a decent bear case is building up. However, do not get that easily fooled. The bull still has more legs.

"While we acknowledge that, technically, there is a potential for a correction, we would not be cutting stocks exposure on a 6-9 months horizon, and continue to see any dips as buying opportunities. We think that it is more likely that we will be raising our year-end targets, rather than reducing them, as we move through the summer"

https://themarketear.com/
 

Attachments

  • zabcd.jpg
    zabcd.jpg
    39.4 KB · Views: 66
Will seasonality matter this summer?
Entering summer has traditionally not been a favourable time for equities. Seasonality of MSCI World performance (since 1970)

https://themarketear.com/
 

Attachments

  • zabcd.jpg
    zabcd.jpg
    26.4 KB · Views: 64
Signals Indicate Caution For Stocks
by likesmoneystudies

Stocks delivered caution signals on Monday.

Monday was day 31 for the daily equity cycle, placing stocks in their timing band for a daily cycle low. There had been bearish divergences developing on the oscillators that yielded to bearish crossovers on Monday. Stocks also formed a daily swing high on Monday. At 31 days, a close below the 10 day MA will signal the daily cycle decline. Stocks should then go on to break below the daily cycle trend line as it seeks out its daily cycle low. Stocks are currently in a daily uptrend and will remain so unless they close below the lower daily cycle band.

https://likesmoneycycletrading.wordpress.com/author/likesmoneystudies/
 

Attachments

  • zabcd.png
    zabcd.png
    104.8 KB · Views: 76
The 4/24/21 Weekend Report Preview

The higher high on Friday locks in a right translated daily cycle formation. At 35 days, that places stocks in their timing band for a daily cycle low. A break below Tuesday’s low of 4118.38 will signal the daily cycle decline. However, stocks have been going vertical since the March DCL.

One strategy is be to use Tuesday’s low of 4118.38 as a stop. If stocks close above Friday’s high of 4194.17 then Friday’s higher will become the stop. Another strategy one could use is a swing high and break below the accelerated trend line to signal the daily cycle decline. As stocks continue to get stretched above the 200 day MA, once a correction begins — it will likely be violent. A third strategy would be to decide to lock in profits early and wait for the next cycle low.
 

Attachments

  • a.png
    a.png
    32.4 KB · Views: 63
Gold - was that it?
Gold managed bouncing 120 bucks from "panic" lows a few weeks ago.

The long term trend channel remains intact. Note the reversal off the 100 day moving average so far.

The latest bounce has been accompanied by the falling DXY, so watch the dollar closely as well, but if gold can't take out new recent highs with the DXY here, it probably doesn't have more steam to push higher for now.

UBS was out with a gold derivative logic a few weeks ago. The call itself was not great from a timing perspective, but the arguments are still valid and much more attractive here; basically use elevated upside in gold to earn extra yield, especially for the crowd that is stuck with strategic long gold position that won't be sold in the near future. Regular readers of TME know gold trades with a positive skew, i.e upside is relatively expensive.

The bank also notes that gold option trade with a positive vol risk premium, i.e vol itself is rich versus realized moves, adding to the overwriting of upside calls logic.
https://themarketear.com/
 

Attachments

  • a.jpg
    a.jpg
    60.2 KB · Views: 61
UUP weekly: It could be making a higher low..... We should know soon.

UUP remains in a downtrend and is below all the MA's I use....
 

Attachments

  • a.jpg
    a.jpg
    58.5 KB · Views: 58
SPY/GDXJ/GLD/UUP daily ratio chart: What happens if we have a flight to safety and the dollar moves up again.
 

Attachments

  • a.jpg
    a.jpg
    68.7 KB · Views: 77
VIX weekly: The gap filled and the VIX is trying to bounce. Not many care about buying protection these days.

It's only week two since the VIX weekly gap filled. So, we shall see if it can start making higher lows and maybe a move back up to the lower BB.

Bottom Line: Not much fear out there of a market sell off even though the insiders have been selling for months at record levels. Go away in May be up next.....
 

Attachments

  • a.jpg
    a.jpg
    67 KB · Views: 80
Bearish Divergence
Monday was day 36 for the daily cycle, placing stocks in their timing band for a daily cycle low. The bearish divergence on the oscillators has me suspicious that any breakout will be reversed to send stocks into their daily cycle decline. At this point a close below the 10 day MA will signal the daily cycle decline. And a close below Tuesday’s low of 4118.38 would be a lower low, confirming the daily cycle decline.
https://likesmoneycycletrading.wordpress.com/2021/04/26/bearish-divergence-3/
 

Attachments

  • a.png
    a.png
    51 KB · Views: 67
SPY daily: The trend remains up, but getting deep into this daily cycle.
 

Attachments

  • a.jpg
    a.jpg
    55.5 KB · Views: 73
You noticed this equity thing over past weeks?
Equities stuck in a range, with bigger candles, but no direction at all.

At the same time we have seen VIX rise.

The same can be observed in NASDAQ as well, with the VXN rising even more than VIX.

VIX and VXN remain stressed.

Our latest VIX logic outlined some 2 weeks ago
https://themarketear.com/
 

Attachments

  • a.png
    a.png
    127.6 KB · Views: 57
Back
Top