Bear Cave 2 (Bull Allowed)

You noticed this equity thing over past weeks?
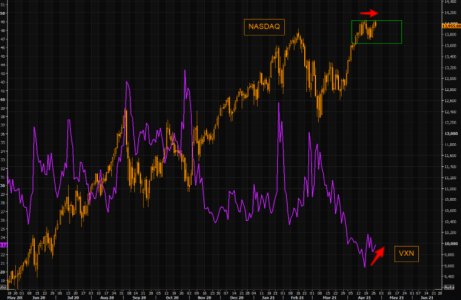
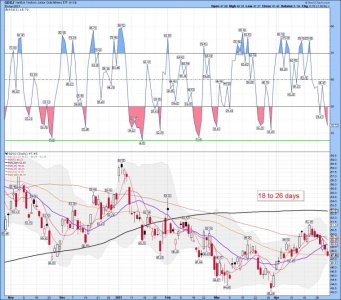
Equities stuck in a range, with bigger candles, but no direction at all.

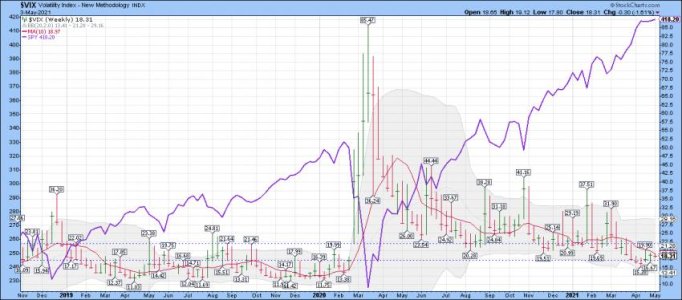
At the same time we have seen VIX rise.

The same can be observed in NASDAQ as well, with the VXN rising even more than VIX.

VIX and VXN remain stressed.

Our latest VIX logic outlined some 2 weeks ago
https://themarketear.com/
 

Attachments

  • a.png
    a.png
    113.9 KB · Views: 72
VIX weekly: I still think we are close to a move back to the upper BB.
 

Attachments

  • a.jpg
    a.jpg
    91.2 KB · Views: 67
USD weekly: Might be completing the next higher low..... For now remains under all the ma's I track. Week four since tagging the upper BB.
 

Attachments

  • a.jpg
    a.jpg
    54.5 KB · Views: 68
USD daily: Remains in a downtrend, but this cycle is getting stretched. We could see a possible bounce soon.
 

Attachments

  • a.jpg
    a.jpg
    64 KB · Views: 76
SPX daily cycle data: After breaking bullishly higher high on Thursday, stocks failed to deliver bullish follow through on Friday.

Friday was day 40 for the daily equity cycle. That places stocks in their timing band for a DCL. Stocks formed a daily swing high on Friday. A close below the 10 day MA (4143.69) will signal the daily cycle decline. Stocks are currently in a daily uptrend and will remain so unless they close below the lower daily cycle band.

https://likesmoneycycletrading.wordpress.com/
 

Attachments

  • a.png
    a.png
    94.7 KB · Views: 82
Last edited:
Counting the Chickens Twice
John P. Hussman, Ph.D.
President, Hussman Investment Trust

May 2021
There’s an old bit of advice that one shouldn’t count one’s chickens before they’re hatched. Much of the efforts of Wall Street are directed at ignoring that advice. That’s fine in the sense that prices can and often do move in advance of changes in economic activity and earnings.

Of course, Wall Street can also take its chicken-counting to extremes. Indeed, every speculative episode is based, in part, on extrapolating the addition and multiplication of chickens into the indefinite future. One of the most striking examples of excessive chicken-counting here is the way that Wall Street analysts and financial television anchors are equating the very reasonably expected post-pandemic “recovery” of private income and employment with an equally inevitable boom in real GDP, corporate earnings, and stock prices.
https://www.hussmanfunds.com/comment/mc210502/
 
SPX daily: The trend remains up..... Good luck trying to pick a top! There are warning signs, but I just trade the trend these days and it remains up!

Trending above the 5, 10, 20, 50, 100, and 200 dma, but stretched above the 200 dma..... These days that doesn't matter....
 

Attachments

  • a.jpg
    a.jpg
    70.3 KB · Views: 82
Last edited:
David Rosenberg
@EconguyRosie

Apr 30
If the Fed ever does taper, risk assets get crushed, the dollar soars, commodities get crunched and any tantrum in Treasuries will be a huge buying opportunity. QE is only there to generate a positive wealth effect.
https://twitter.com/EconguyRosie?lang=en
 
VIX weekly: I still think the VIX is headed back for a tag of the upper BB this month. However, that be a guess and I trade the trend which remains up.
 

Attachments

  • a.jpg
    a.jpg
    64.8 KB · Views: 80
Staying all in
Positioning remains elevated as US Equity L/S gross leverage stand at 200% (90th %tile over last 12M and the 99th %tile since 2010). Nets are 66%, which represents the 93rd %tile over the last 12M and the 99th %tile since 2010. Are most investors finally “full” as it pertains to equities?
https://themarketear.com/
 

Attachments

  • a.png
    a.png
    89.1 KB · Views: 88
SPX daily: A cycle low already?!!

Stocks closed below the 10 day MA on Tuesday to signal the daily cycle decline.

Stocks printed their lowest point on Tuesday, day 42. That places stocks in their timing band for a daily cycle low. Stocks should break below the daily cycle trend line in order to complete their daily cycle decline. However, we may need to be open to the possibility that this is all the correction that we will get at this time.
https://likesmoneycycletrading.wordpress.com/2021/05/04/daily-cycle-decline-5/
 

Attachments

  • a.png
    a.png
    93.6 KB · Views: 77
SPX daily: We did see a move below the 20 dma, but buyers came in quickly and painted a nice close. We shall see if we close above the 10 dma today.
 

Attachments

  • a.jpg
    a.jpg
    70.5 KB · Views: 89
SPX daily: A closer look..... Using the 20 dma and the 50 dma in this market is best for preventing whipsaws.... Buying the 50 dma tags has been a good buy point. Reducing risk and selling some after tagging the upper BB has worked well too. If one does mind trading the ebb and flow.
 

Attachments

  • a.jpg
    a.jpg
    63.4 KB · Views: 89
SPX daily: Some excellent trend trading so far this year../..

This year is just like...1963?

Jason Goepfert Published: 2021-05-05 at 07:30:00 CDT
Through the first 4 months of the year, stocks have barely suffered any downside volatility. This seems like 2013 or 2017, two other recent years that were marvelous for trend followers and miserable for pretty much every other strategy.


This year is just like...1963?
Jason Goepfert

https://www.sentimentrader.com/blog...l&utm_term=0_1c93760246-d5c49b175d-1271291994
 

Attachments

  • a.jpg
    a.jpg
    67.7 KB · Views: 85
SPX daily: Having some trouble moving back above the 10 and the 5 dma...... We shall see how all of this plays out in the days ahead. For now my system remains in a go to cash signal. However, I have unlimited moves in my trading accounts so it's very easy to buy again.
 

Attachments

  • a.jpg
    a.jpg
    67.7 KB · Views: 85
Back
Top