-
The Forum works well on MOBILE devices without an app: Just go to: https://forum.tsptalk.com
-
Please read our AutoTracker policy on the IFT deadline and remaining active. Thanks!
-
$ - Premium Service Content (Info) | AutoTracker Monthly Winners | Is Gmail et al, Blocking Our emails?
Find us on: Facebook & X | Posting Copyrighted Material
-
Join the TSP Talk AutoTracker: How to Get Started | Login | Main AutoTracker Page
You are using an out of date browser. It may not display this or other websites correctly.
You should upgrade or use an alternative browser.
You should upgrade or use an alternative browser.
Bear Cave 2 (Bull Allowed)
- Thread starter robo
- Start date
robo
TSP Legend
- Reaction score
- 471
The Speculative “V”
Print Friendly, PDF & Email
John P. Hussman, Ph.D.
President, Hussman Investment Trust
January 2021
The full-cycle and long-term market outlook remains dismal
I continue to expect a loss in the S&P 500 on the order of 65-70% over the completion of the current market cycle. As I noted about my 83% loss projection for tech stocks in March 2000, “if you understand values and market history, you know we’re not joking.” A loss on the order of 65-70% would merely bring the S&P 500 to historical norms that have been followed by historically run-of-the-mill returns.
Still, suppose one believes that U.S. stocks should forever be priced at levels implying long-term returns of roughly 5.5% annually (without ever approaching 9% or even 7%). In that world, stock prices and fundamentals would grow in parallel, but the ratio between prices and fundamentals would have to maintain a “permanently high plateau.” We can’t actually rule that out, but one should also realize that an increase of just 0.5% annually in the long-term return required by investors would still induce a 25% market loss. So even slight variations in permanently extreme valuations and permanently low returns would produce substantial cyclical volatility anyway, and as full-cycle investors, we’d be just fine with that.
https://www.hussmanfunds.com/comment/mc210118/
robo
TSP Legend
- Reaction score
- 471
Investing When Intoxicated
Jan. 18, 2021 4:52 AM ET
Steven Jon Kaplan
Contrarian, ETF investing, Portfolio Strategy
Summary
The large-cap Nasdaq collapses of 1973-1974 and 2000-2002 are likely to be repeated along with severe losses for many other fluctuating assets.
Safe-haven assets have quietly completed important bottoming patterns.
The disappearing Trump mystique provides an emotional excuse for "huge" asset losses.
We have experienced all-time record levels of speculative call buying, penny-stock chasing, massive percentage increases for marginally profitable companies, IPO eagerness, and numerous other multi-decade and even multi-century records, which, in many cases, have surpassed rare bubble extremes from periods like 1928-1929, 1972-1973, and 1999-2000.
https://seekingalpha.com/article/43...ampaign=rta-author-article&utm_content=link-1
robo
TSP Legend
- Reaction score
- 471
Retail Army: have they opted for the nuclear option?
Some perspective on Retail Army and their propelling of the stock market higher. Retail investors have grown to over 55% of the options market, up from 40-45% pre-COVID. In the cash market, QDS estimates that Retail is 18-20% of cash market volumes (in # of shares terms), up from 10-12% pre-COVID. More data points stand out… Demand for single-name call options continues to accelerate with $285bn in call ADV over the last week (4 std dev above avg), $13bn in new premium spent on calls last week (vs $2bn run rate pre-COVID), odd lot volume just off historical highs, and low dollar priced volume exploding, to name a few
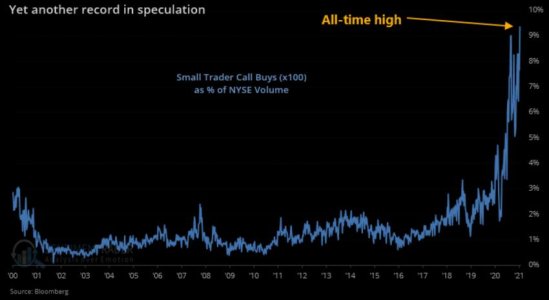
Welcome to speculation all time high
Small trader call buying mania exceeded 9% of total NYSE volume last week (adjusted for equivalent shares). Everybody is an options pro, but have probably no clue about theta and other greeks. On the other hand, do you need that knowledge if you are buying lottery tickets only?
https://themarketear.com/
Attachments
Bullitt
Market Veteran
- Reaction score
- 75
LOL.... Another whipsaw..... Waiting to see how this plays out.....
Looks like Don is back on a 50% sell as of 1/15.
robo
TSP Legend
- Reaction score
- 471
Looks like Don is back on a 50% sell as of 1/15.
LOL..... Yes Sir! He "SHOULD" start building a short position this week if he doesn't get whipsawed again. We should see some increased selling pressure this week in the stock market. The futures are up which is normal for easy money Monday, or Tuesday in this case due to the holiday.
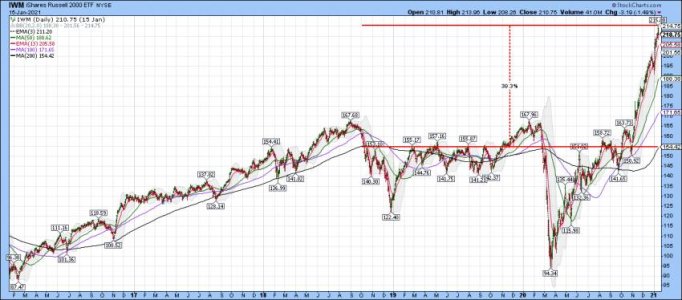
The herd sure love's small caps.....
Attachments
Last edited:
robo
TSP Legend
- Reaction score
- 471
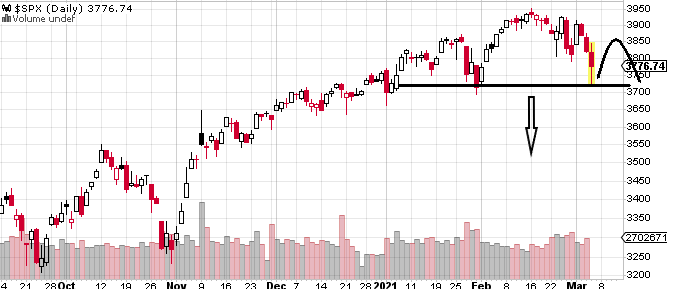
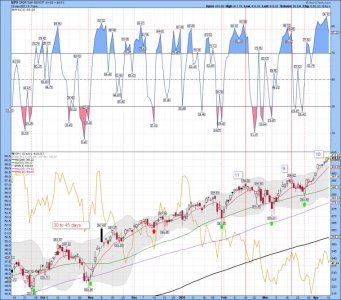
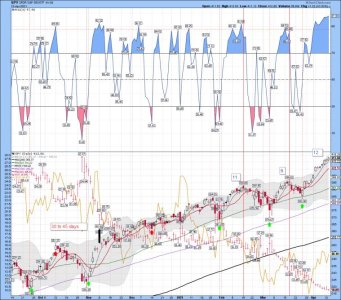
SPY daily: The trend remains up so you have to be in cash or long SPY....
Amazing!
Investors have put more money into stocks in the last 5 months than the previous 12 years combined
PUBLISHED FRI, APR 9 202110:41 AM EDTUPDATED FRI, APR 9 20212:07 PM EDT
KEY POINTS
More money has gone into stock-based funds over the past five months than the previous 12 years combined, according to Bank of America.
In raw numbers, $569 billion has flowed into global equity funds since November, compared with $452 billion going back to the beginning of the 2009-2020 bull market.
“There’s a certain amount of logic to markets right now,” said Art Hogan, chief market strategist at National Holdings.
https://www.cnbc.com/2021/04/09/inv...=Social&utm_source=Twitter#Echobox=1617997709
Attachments
robo
TSP Legend
- Reaction score
- 471
You can sign up for a free daily newsletter at the link below.
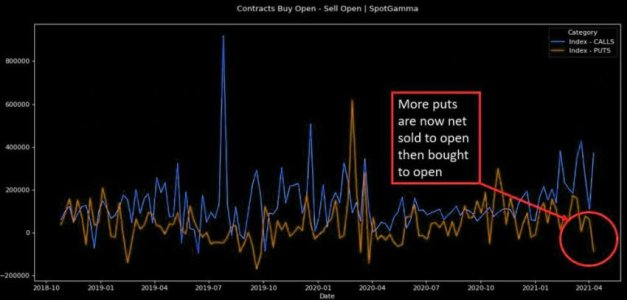
FOMO creates inverted hedging
Not overly surprising given the melt up as greed kicks in, but add this one to possible accidents about to happen.
People are opening more puts to sell than to buy. Yes, that is basically the Texas hedge.
This is what you want to see at market lows, not here.
Watching closely...
https://themarketear.com/
Attachments
robo
TSP Legend
- Reaction score
- 471
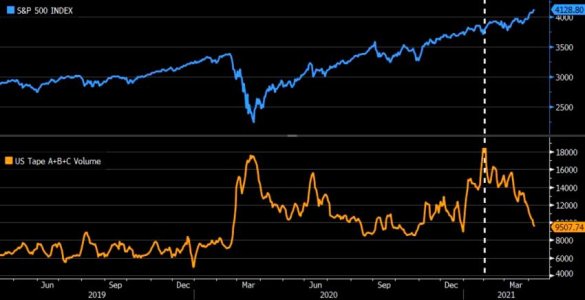
When there is no yelling you should not be selling
The volume melt-down continues. You could argue that it is just reversing to mean, but it is still very different from how the year started. And, more importantly, our own proprietary "noise" indicator (that measures incoming activity from sell-side) is at extreme Christmas like levels. That supports a quiet continued low volume melt-up.
https://themarketear.com/
Attachments
robo
TSP Legend
- Reaction score
- 471
From a 2 day settlement to a 1 day settlement - The new guy is about to take over.....
Gary Gensler has a full agenda as he gets set to take over the SEC
whether it is feasible to move from the current two-day settlement period for stocks (T + 2) to a one-day settlement period.Gamestop fallout
The Gamestop situation has led to numerous calls for investigations around gamification of trading, market manipulation, and whether it is feasible to move from the current two-day settlement period for stocks (T + 2) to a one-day settlement period.
In a recent call with reporters, Christopher Gilkerson, Charles Schwab’s senior vice president and general counsel, said any reform initiated by Gensler “would focus on rapidly moving to T+1 settlement, better surveillance on potential market manipulation through social media and better disclosure for short sellers. And probably a focus on gamification of investing.”
https://www.cnbc.com/2021/04/14/gar...enda-as-he-gets-set-to-take-over-the-sec.html
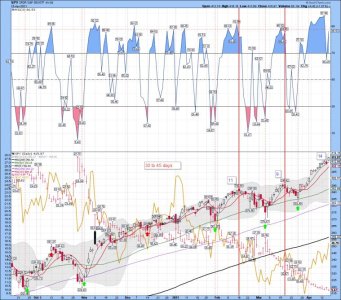
SPY daily chart: The move up continues.....
Attachments
robo
TSP Legend
- Reaction score
- 471
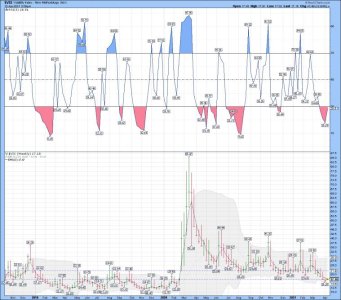
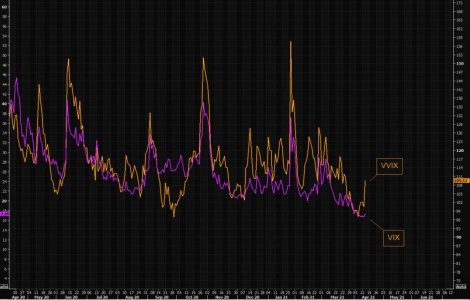
Watching th VIX....
VVIXed?
Earlier today we wrote about the number one inverse indicator when it comes to picking lows in VIX, our "VIX guy".
Looks like he picked it again (the inverse way), creating an almost 100% track record since we first mentioned him a few years ago.
VIX is up, but even more noteworthy is the move in VVIX.
Watch the gap between VVIX adn VIX carefully....
https://themarketear.com/
Attachments
DreamboatAnnie
TSP Legend
- Reaction score
- 838
From a 2 day settlement to a 1 day settlement - The new guy is about to take over.....
Gary Gensler has a full agenda as he gets set to take over the SEC
whether it is feasible to move from the current two-day settlement period for stocks (T + 2) to a one-day settlement period.Gamestop fallout
The Gamestop situation has led to numerous calls for investigations around gamification of trading, market manipulation, and whether it is feasible to move from the current two-day settlement period for stocks (T + 2) to a one-day settlement period.
In a recent call with reporters, Christopher Gilkerson, Charles Schwab’s senior vice president and general counsel, said any reform initiated by Gensler “would focus on rapidly moving to T+1 settlement, better surveillance on potential market manipulation through social media and better disclosure for short sellers. And probably a focus on gamification of investing.”
https://www.cnbc.com/2021/04/14/gar...enda-as-he-gets-set-to-take-over-the-sec.html
SPY daily chart: The move up continues.....
Hi Robo, Thanks for this info! :smile:
DreamboatAnnie
TSP Legend
- Reaction score
- 838
Love charts you posted (Posts 1489 & 1492) and especially your post on VIX versus VVIX. 


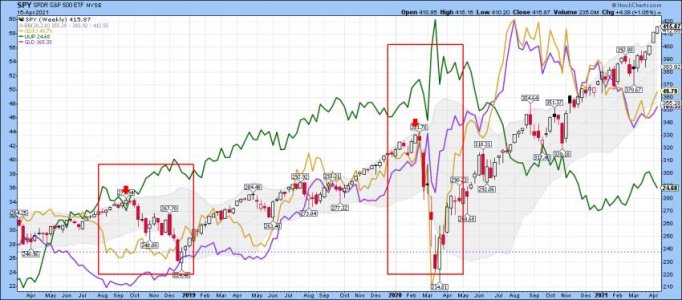
What is the gold line and what comparison is represented by overlying red OHLC price bars (red crosses)?....can't read key. Thank you!

What is the gold line and what comparison is represented by overlying red OHLC price bars (red crosses)?....can't read key. Thank you!
robo
TSP Legend
- Reaction score
- 471
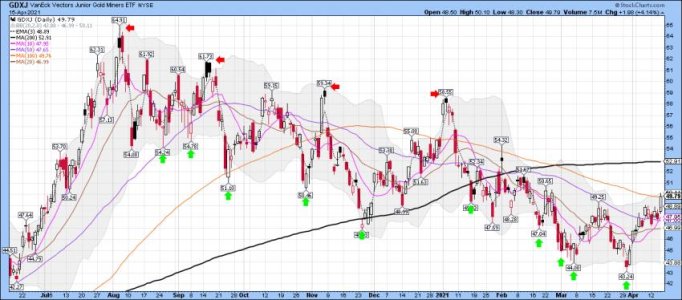
I like to trade GDXJ and look for and use patterns in my trading. Please note what happened to GDXJ ( It is the gold solid line 1492 and 1489) when the SPY topped (candle sticks) and moved lower. GDXJ bottomed closer to when the SPY did. Will that repeat? Not sure, but the pattern says one should be careful here if this pattern repeats.
I remain long GDXJ from $43.75 when I took the lower BB crash trade. This was day 14 for this ST trend......
I remain long GDXJ from $43.75 when I took the lower BB crash trade. This was day 14 for this ST trend......
Attachments
Last edited:
robo
TSP Legend
- Reaction score
- 471
robo
TSP Legend
- Reaction score
- 471
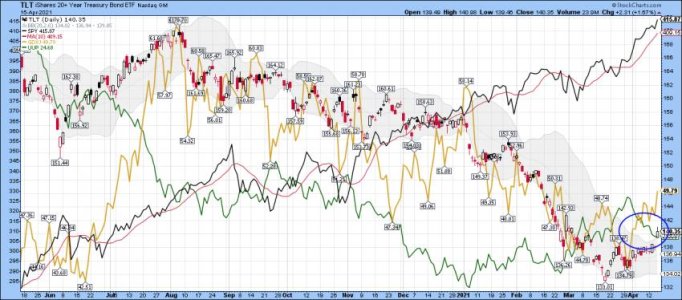
TLT daily - Is normally a flight to safety by the Whales..... Why such a big move up today?
There is a very rare pattern on the TLT daily chart that was produced today. A gap up and a tag of the upper BB. We shall have to see how this plays out. Maybe it means nothing, but I still track any rare or extreme pattern.
There is a very rare pattern on the TLT daily chart that was produced today. A gap up and a tag of the upper BB. We shall have to see how this plays out. Maybe it means nothing, but I still track any rare or extreme pattern.

