Bear Cave 2 (Bull Allowed)

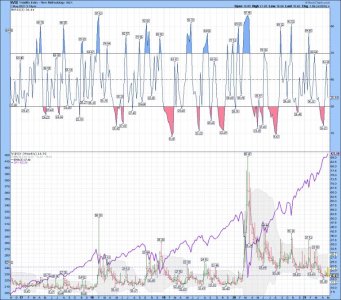
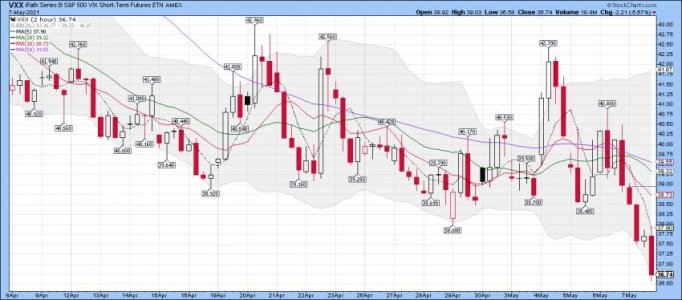
VIX/VXX chart: Heading into the final hour of trading: Anyone buying some VXX if you are long stocks? A lower BB tag for VXX...... We shall see how that plays out....

That tag is a Beer Money Trade for me......

A small position of VXX at Vanguard. I use VXX on occasion as a hedge for my VTI positions or a straight up Beer Money trade if it tags the lower BB. It's no more then a pattern trade..... ( see pattern below) This trade has above average odds of being a winner based on the chart. LOL..... Nothing is every 100% but I like to play the odds on some short-term trades. I will be using a 2% stop or around $50.00ish at risk.....

Account: robo
Transaction type: Buy
Order type: Market
Security: BARCLAYS IPATH SER B S&P 500 VIX SHORT TRM FUTURE ETN NEW (VXX)
Quantity: 100 share(s)
Price:* $22.95
 

Attachments

  • a.png
    a.png
    46.7 KB · Views: 90
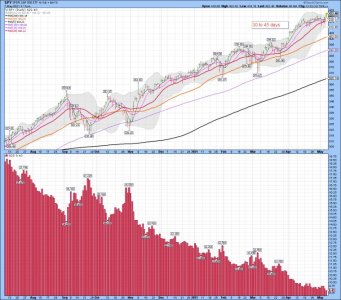
SPY and VTI daily charts: Nice moves above the 50 sma on the daily charts..... Folks are covering.......
 

Attachments

  • a.png
    a.png
    87.2 KB · Views: 86
  • a.png
    a.png
    34.4 KB · Views: 85
IT swing low looking very possible today.

It Looks pretty darn good so far. I still like to use VTI for trend trading, and the buyers just took it back above the 10 week sma. One would think there is some short covering going on here... LOL..... We know a couple of GURU's that are still short. The last time VTI moved above the 10 week sma the STRer's took some profits, and I got whipsawed. We shall see how this move plays out.....

STR = Sell the Rip
 

Attachments

  • a.png
    a.png
    34.9 KB · Views: 98
SPY daily: Ok, a nice gap up to start the day..... We shall see where it goes..... The Bulls will want the 50 sma back ..... What the bulls don't want to see is another lower higher.

VTI daily: Nice! Testing the 50 sma....
 

Attachments

  • a.png
    a.png
    34.1 KB · Views: 77
  • a.png
    a.png
    30.6 KB · Views: 75
Last edited:
VTI weekly (The Total Stock Market): It looks like we might just get back above the 10 week sma this morning.....
 

Attachments

  • a.png
    a.png
    34.5 KB · Views: 76
  • a.png
    a.png
    23.7 KB · Views: 75
GDX daily: It looks good...... We shall see how it plays out. Tagging the upper BB hasn't been good for sometime now. We shall see if this is the start of a much bigger move up....
 

Attachments

  • a.jpg
    a.jpg
    179.3 KB · Views: 82
Still a few weeks off in the making, but a break of the downtrend and 10DMA would set up a reverse head and shoulders. Upside would be new highs.

Positive seasonality is right around the corner and setting up nicely with market fear in October. News articles saying Christmas won't happen because of port congestion and shortages is nonsense.

Canada and Mexico borders will be opening in November.

For now the trend is grinding higher on the daily, but it's the weekly buy signal I want to see. We shall see if the Bulls/Buyers can get a weekly buy signal in the days ahead.

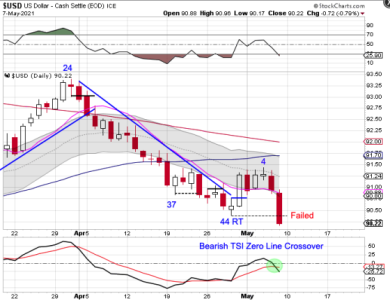
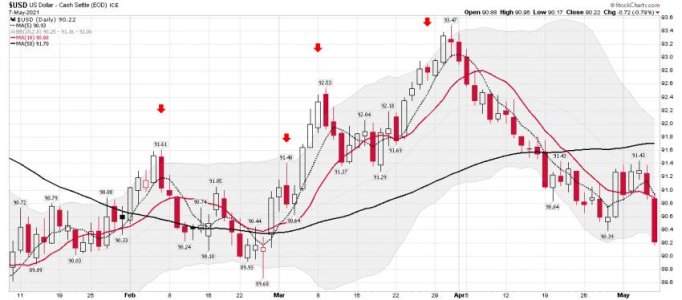
A BIG smash of the dollar today didn't help stocks much. Still, if you are trading the daily things looks ok, ( a move back above the 10 sma) but if you are using the weekly things are still in a down trend. The daily needs to get back above the 20 sma and 50 sma on the daily charts before I will be calling it a trend. Lots of help from the dollar today pushing the indexes higher I track. They moved back above the 3 ema and the 10 sma. A good start, but there is still lots of work to signal the all clear. The dollar smash was a huge help to the metals/miners........ It should bring in the chasers, and with good reason.

Note the the 3 ema on the weekly, and VTI and SPY both remain below the 10 week sma. Not what we want to see if you are long.
 

Attachments

  • a.png
    a.png
    35.1 KB · Views: 62
  • a.png
    a.png
    26.7 KB · Views: 62
  • a.png
    a.png
    29.8 KB · Views: 64
  • a.png
    a.png
    38.6 KB · Views: 62
Last edited:
Still a few weeks off in the making, but a break of the downtrend and 10DMA would set up a reverse head and shoulders. Upside would be new highs.

Positive seasonality is right around the corner and setting up nicely with market fear in October. News articles saying Christmas won't happen because of port congestion and shortages is nonsense.

Canada and Mexico borders will be opening in November.
 
SPY daily: Heading into the last hour of trading and the Bulls got the SPY index back above the 10 sma and the 100 sma. Looks like the 3 ema will get tested too. Still looks weak to me as the market waits on whatever it's waiting on......

I will wait to buy back shares of VTI ( The total stock market at Vanguard) Waiting to see how we close, but still NO BEEF!

One hour to go...... and the Bulls are holding above the important sma's and ema's I use for trading..... Waiting!

I posted a link above about the ema and sma a few days ago...... The data is in the upper left corner of my trend trading charts.
 

Attachments

  • a.png
    a.png
    32.5 KB · Views: 65
I remain long GDX and SLV: I reduced GDX by 1/2 today..... We shall see how that plays out in the days ahead.....

GDX weekly: A buy signal in play..... Week 2 for a move above the 3 ema on the weekly chart, and a move above the the 10 sma today. I'm sure the Bugs and many traders will being looking to add or buy this move above the 10 week sma. I don't know how this will play out, but as a trend trader I have to trade what is happening and not what I think will happen.

Bottom Line: The weekly data on the GDX chart remains in an uptrend. Whipsaw coming? LOL..... I sure don't know, but in this sector it's possible.

For the record: I NEVER go above 10% on any single index when trading. That includes GDX and SLV. If either one were to double I would be taking profits on the way up...... I'm a trader NOT an investor, and there are lots of other good things out there to trade. I will leave the ALL IN for the BUGS..... I have seen to many of them lose lots of money in this sector, and so HAVE I when I first started trading this sector. I will also be using NUGT and AGQ for short-term trading as we move higher.

The Strongest Buy Signal in Years
By Jeff Clark, editor, Market Minute

The Bullish Percent Index for the gold sector (BPGDM) just triggered one of the strongest gold stock buy signals in four years.

The BPGDM generates only one or two trading signals each year. The last buy signal we got back in March kicked off a three-month-long 30% rally in the gold sector.

This current buy signal is set up to be even more powerful.

Let me explain…
https://www.jeffclarktrader.com/market-minute/the-strongest-buy-signal-in-years/
 

Attachments

  • a.png
    a.png
    14.4 KB · Views: 61
  • a.png
    a.png
    54.8 KB · Views: 58
Last edited:
GDX and SLV daily: Remains in a hold long positions.....

GDX moved above the 50 sma today. You could see a smack down anytime in this sector.... I'm going to reduce by 1/2 with this gap up and see if fills in the next few days. We also have a upper BB tag and a move above so we shall see how that plays out.

GDX: The trend has remained up after printing the $28.83 marker. GDX also printed a (-55.73 marker TSI data) which was very oversold. This is day 10 since the move above the 3 ema.

Good Trading as we wait for something to come out of the White House that will move this market. Money is moving into the metals/miners this morning!
 

Attachments

  • a.jpg
    a.jpg
    163.4 KB · Views: 70
Last edited:
SPY daily: Another tag of the 100 sma on the daily and a close to the 10 sma. The opening looks flat..... Is the market waiting on a deal from the White House..... LOL.... me too!

SPY daily: A closer look
 

Attachments

  • spydaily.jpg
    spydaily.jpg
    151.3 KB · Views: 66
  • a.png
    a.png
    34.7 KB · Views: 65
VTI daily after the close : VTI remains above the 10 day sma on the daily chart. However, I'm waiting for a confirmed buy signal on the weekly using my trading system. So I continue to only (ST) short-term trade both ways.

VTI weekly after the close: Where is the BEEF!

Bottom Line: Waiting to buy back VTI again..... The buyers are just not coming in or someone is slowly taking profits..... LOL..... Either way I will just trade what is happening and not what I think will happen. The weekly VTI index ( The Total Stock Market at Vanguard) remains below the 10 week and the 20 week sma, and is also below the 3 week ema. Not what I want to see..... VTI is still trending/grinding down/lower on the weekly chart.

Have a nice day!
 

Attachments

  • vtidaily.png
    vtidaily.png
    40.1 KB · Views: 70
  • vtiweekly.png
    vtiweekly.png
    34.9 KB · Views: 67
VTI daily: Holding above the 10 sma. but having some trouble at the 3 ema..... Still NO BEEF!

VTI weekly: Waiting on the next buy signal..... Still more sellers then buyers for the overall stock market. ( VTI is the Total Stock Market)

Bottom Line as I wait for a weekly buy signal: VTI remains below the 10 and 20 week sma. The 3 ema is still trending down and VTI remains below it too. Waiting on the big spending bill to pass, and I still think some are tax selling now. They are front running next year's increases, and these tax increases are coming for those earning over 400k a year. Also, long-term capital gains are going to increase. Not talked about much right now, but I think that will change in the weeks ahead when those bills are passed.

LOL...... Still NO BEEF!

VTI weekly: A closer look.... The weekly trend remains down and I'm a Trend trader!
 

Attachments

  • a.png
    a.png
    39.3 KB · Views: 74
  • a.png
    a.png
    30.5 KB · Views: 73
  • a.png
    a.png
    25.2 KB · Views: 74
Last edited:
Adding a small beer money trade. Buying back VXX under $24.40 again.
I don’t normally hold VXX over night.
 
SPY daily: Tagging the 10 sma this morning...... The Bulls will want to hold that line if possible. There still seems to be to many sellers right now. Watching!

VTI weekly: The grind lower continues.....
 

Attachments

  • a.jpg
    a.jpg
    165.8 KB · Views: 77
  • a.png
    a.png
    27.1 KB · Views: 76
LOL....... I'm just going too trade what is happening in real-time....... However, investors probably have lots of things to look over in the months ahead. I also think taxes are going up next year. So are we going to see some tax selling? I think we are already seeing some....

The top 10 questions for Goldman right now
Here's a smattering of 10 questions Goldman are monitoring:

1. Will the recent rise in inflation prove to be temporary or more sustained?

2. Will the Fed raise rates sooner than markets expect?

3. Will the labor shortage resolve itself or has something structurally changed in how people work?

4. Will China's issues spillover to global growth?

5. Will the latest wave of the virus remain contained?

6. Will the spike in commodities suppress earnings growth across a range of sectors?

7. Can corporate earnings overcome the headwinds of supply chain bottlenecks?

8. Will Washington DC reach a longer dated agreement on raising the US debt limit?

9. Will Congress be able to pass an infrastructure bill or have we already seen the last fiscal stimulus of this cycle?

10. Can the S&P 500 Index go up if the FAAMG complex underperforms? (Goldman Sachs).

Could higher energy prices trigger a recession?

With energy costs as a % of GDP up to 7% this month, Sanford Bernstein notes that history shows that the probability of a recession increases when energy costs exceed this level for a prolonged period of time (>1 year). Bernstein: "We aren’t there yet, but coal and natural gas have been responsible for much of the inflation in energy costs. While the recent spike in energy costs may prove transient, a protracted period of energy costs (>1 year) or further rise in oil to over US$100/bbl could trigger a slowdown in global economic growth as disposable income gets squeezed. On an annual basis, the cost of oil as a percent of GDP is unremarkable at ~3% and well below the 5% peak. A rise in oil prices above $100 per barrel alongside high coal and gas prices could push energy prices to levels which damage economic growth" (Sanford Bernstein)
https://themarketear.com/
 
Last edited:
VTI weekly: I remain fixed on the weekly VTI data/chart. VTI remains below the 3 ema so I remain flat. I need to see a move ABOVE and a close above the 3 ema and 10 sma with some BEEF. As you can see that happened just a few weeks ago. That be a whipsaw for me, and we did GET THE BEEF!
 

Attachments

  • a.png
    a.png
    25.2 KB · Views: 65
Back
Top