Uptrend's Account Talk

Uptrend: Thanks so much for sharing your analyses, charts and thoughts on the market; your "macro view of the market" blog post yesterday and your thoughts about it today. Very informative & helpful.
Your "macro-view of the market" chart link you shared yesterday... for what its worth, I noticed a line you hadn't drawn that, if relevent, supports your your assessment of SP500 topping now. It is a line through the lows from June to now, which approximately intersects with the levels we are now as resistance, perhaps slightly below the prior all-time high as resistance too. Anyway, thanks again.
 
A weak bounce is underway this AM. Not sure if it is sustainable. My Uptrend system works in the daily time-frame and is still on "sell" for S and C.TNA started hard out of the gate, but has faded some now. The US dollar(as tracked by UUP) is in conflict; down in the weekly timeframe, while up in the daily. If it does keep falling it will boast the I fund, gold and commodities. EFA has a black doji candle right now, not really the reversal I am looking for - need a hollow red or solid white.

The F fund (as tracked by AGG) is putting in solid evidence that a turn is near. The weekly candle is a doji or northern shooting star. Also the AD/total volume are solidly up, so a weak turn may be underway or a temporary bottom is around here somewhere. Buying across the board is quite uneven, and oil stocks are down again. RIG has fallen for 18 weeks from 44 to 28! The Ebola scare hit the airlines, but I see DAL up this AM about 5%. The coal sector is at historic lows and you can blame the rapid rise in the USD over the last 12 weeks for that, plus EPA regulations, weak demand and market manipulation. Whether the bottom is in for gold remains to be seen. There has been a little rebound and triple bottom from 1180. The gold silver ratio is still 71, which is way to high. In other words silver is way to cheap in comparison to gold - just picked up some SSRI.

Not sure what to do here - by the time you decide, the rally may be half over. I am not looking for the dead cat bounce, want a rally that back-tests SPX 1929 or the 1950 area. Bottoms take time to develop so would not be surprised to see sideways trading all week with another downside scare. If that happens to be a higher low; well then it might a an entry clue.
 
Looks like $EMW will hold up about 1% into the close, and TNA about 3%. TNA btw is holding onto a major trendline going back to 2012 on the weekly and is sitting right at the decision line near 56.50. Is the market putting in a bottom just before a strong Nov-Dec rally? US economy does not look that bad to me, so I am thinking that this is a healthy cooling off before the market takes off again. I expect volatility this week, while the indices set up positive divergences. Bonds are really getting overbought. Oil is heading down and that will free up consumer spending. I will take $2.50 gasoline!
 
The spike down at the open from SPX 1874 to 1837 took all of 10 minutes. The 1840 pivot area satisfies my requirement for the turn-around point. Not that it couldn't be retested. We now have a higher low, however on the $EMW. So taking a chance on S. One of the largest hits I have ever seen on AGG and it is still up 0.56%. Going to S today.
 
The spike down at the open from SPX 1874 to 1837 took all of 10 minutes. The 1840 pivot area satisfies my requirement for the turn-around point. Not that it couldn't be retested. We now have a higher low, however on the $EMW. So taking a chance on S. One of the largest hits I have ever seen on AGG and it is still up 0.56%. Going to S today.

I missed the deadline but I will be following everything closely tonight and in the morning with plans to follow you into S soon.
 
Closing GREEN, just as I suspected yesterday. You can't fool breadth indicators. More analysis tonight and a plan where the market may be headed.
 
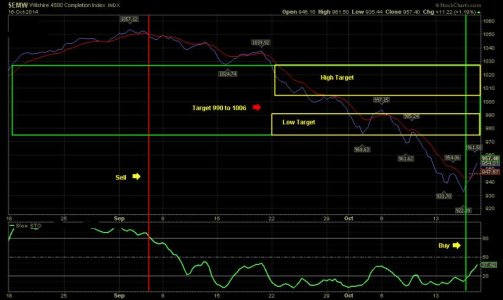
Here is the S fund roadmap, tracked by $EMW. In the big picture I believe the market is in a downtrend of the ABC form. Primary wave A just completed at 923 and now primary wave B is underway. As seen on the figure, the most probable upward targets are somewhere between 990-1006. For an extreme rally we could see 1028 and 975 for a short rally. Based on the 957 close today that is approximately a 3.4-5.1% gain for a typical rally, 7.4% for extreme and 1.8% for a short rally. In terms of time I expect the rally to be over on Nov 3, but could extend to mid Nov for an extreme rally. In the big picture I believe we are still in a bull market, just some healthy bleeding and tax loss selling. I will have more to say later about where I think the bull will resume. Just keep in mind that primary wave C will probably extend further than primary wave A, and so points much lower when this downtrend is over. IMO this is the best chance till Christmas in the TSP to polish off the gains. GLTA

Just missed the top 10 on the overall tracker, coming in at 11 today, but #1 on the non PS tracker. Thanks Firegal for stepping aside! Now who will knock me off the podium is the question??

EMW_10_16_14_F.jpg
 
Here is the S fund roadmap, tracked by $EMW. In the big picture I believe the market is in a downtrend of the ABC form. Primary wave A just completed at 923 and now primary wave B is underway. As seen on the figure, the most probable upward targets are somewhere between 990-1006. For an extreme rally we could see 1028 and 975 for a short rally. Based on the 957 close today that is approximately a 3.4-5.1% gain for a typical rally, 7.4% for extreme and 1.8% for a short rally. In terms of time I expect the rally to be over on Nov 3, but could extend to mid Nov for an extreme rally. In the big picture I believe we are still in a bull market, just some healthy bleeding and tax loss selling. I will have more to say later about where I think the bull will resume. Just keep in mind that primary wave C will probably extend further than primary wave A, and so points much lower when this downtrend is over. IMO this is the best chance till Christmas in the TSP to polish off the gains. GLTA

Just missed the top 10 on the overall tracker, coming in at 11 today, but #1 on the non PS tracker. Thanks Firegal for stepping aside! Now who will knock me off the podium is the question??

View attachment 30693

Uptrend,
you are doing great work. Very helpful analysis. Thank you.
 
Here is the S fund roadmap, tracked by $EMW. In the big picture I believe the market is in a downtrend of the ABC form. Primary wave A just completed at 923 and now primary wave B is underway. As seen on the figure, the most probable upward targets are somewhere between 990-1006. For an extreme rally we could see 1028 and 975 for a short rally. Based on the 957 close today that is approximately a 3.4-5.1% gain for a typical rally, 7.4% for extreme and 1.8% for a short rally. In terms of time I expect the rally to be over on Nov 3, but could extend to mid Nov for an extreme rally. In the big picture I believe we are still in a bull market, just some healthy bleeding and tax loss selling. I will have more to say later about where I think the bull will resume. Just keep in mind that primary wave C will probably extend further than primary wave A, and so points much lower when this downtrend is over. IMO this is the best chance till Christmas in the TSP to polish off the gains. GLTA

Just missed the top 10 on the overall tracker, coming in at 11 today, but #1 on the non PS tracker. Thanks Firegal for stepping aside! Now who will knock me off the podium is the question??

View attachment 30693

Your timing om your last two moves (into F and then into S yesterday) was absolutely superb Uptrend! Congratulations!!!!
 
My Uptrend System posted a buy today at the close for the C and S funds. This system makes very few trades; only about 6-10 a year and is perfect for the TSP limited IFT trade opportunities. You may have noticed that I did front-run the buy signal by 2 days because of indisputable evidence of an impending trend change, on a probability basis. It is always a game of probability, because a black swan could descend at any time with a 5-20% daily loss which is a sobering thought. As with all systems that use data, enough information needs to be collected in order to determine if there is any pattern or just noise. Also it is difficult to program all the relevant factors into a system without a lot of work. This is where the human computer and brainpower come into use.

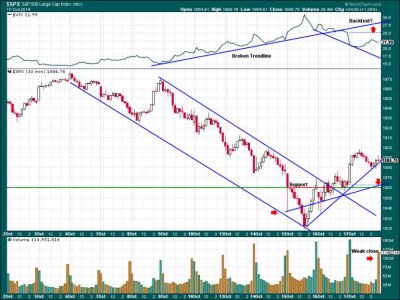
The 30 minute SPX chart shows that the market had a weak close with a high volume selling bar. Weekend jitters? It appears that the angle of take-off on Thursday is too steep to be sustainable. Further the inverse mirroring $VIX broke below the upwards trendline on Thursday that could be back-tested. The support area for SPX is 1864-1860 from angling and horizontal support. Also, the market has entered a period of increased volatility and big spikes are followed by still large, but smaller moves. It is like throwing a rock into a pond; as the ripples go outward the wave amplitude decreases with distance. In this case, think of time as distance. Big moves are followed by mirrored moves but the amplitude is decreasing.

So, if you missed the first opportunity to get in, Monday should provide another chance. The evidence suggests the market may open red.

SPX_10_17_14.jpg
 
Here is the S fund roadmap, tracked by $EMW. In the big picture I believe the market is in a downtrend of the ABC form. Primary wave A just completed at 923 and now primary wave B is underway. As seen on the figure, the most probable upward targets are somewhere between 990-1006. For an extreme rally we could see 1028 and 975 for a short rally. Based on the 957 close today that is approximately a 3.4-5.1% gain for a typical rally, 7.4% for extreme and 1.8% for a short rally. In terms of time I expect the rally to be over on Nov 3, but could extend to mid Nov for an extreme rally. In the big picture I believe we are still in a bull market, just some healthy bleeding and tax loss selling. I will have more to say later about where I think the bull will resume. Just keep in mind that primary wave C will probably extend further than primary wave A, and so points much lower when this downtrend is over. IMO this is the best chance till Christmas in the TSP to polish off the gains. GLTA

Just missed the top 10 on the overall tracker, coming in at 11 today, but #1 on the non PS tracker. Thanks Firegal for stepping aside! Now who will knock me off the podium is the question??

View attachment 30693

Uptrend,

I am following your excellent work with respect to the S fund roadmap, as tracked by $EMW. You expect the rally to end on Nov. 03, but it could extend to mid Nov. in an extended rally. When is the Fed going to announce their decision on the QE matter? Isn't it close to Nov. 3? Tia.
 
Uptrend,

I am following your excellent work with respect to the S fund roadmap, as tracked by $EMW. You expect the rally to end on Nov. 03, but it could extend to mid Nov. in an extended rally. When is the Fed going to announce their decision on the QE matter? Isn't it close to Nov. 3? Tia.
Fed meets Tuesday and Wednesday next week. Fed Fisher from Dallas wants to end QE but not so sure from Yellen. At any rate I think it's already priced in. Looking at $ EMW a different way we could get a back test off 200 SMA currently at 1009. SPX is taking a long time to get back above its 200 SMA and each day it stays down supports a more corrective market view.
 
Fed meets Tuesday and Wednesday next week. Fed Fisher from Dallas wants to end QE but not so sure from Yellen. At any rate I think it's already priced in. Looking at $ EMW a different way we could get a back test off 200 SMA currently at 1009. SPX is taking a long time to get back above its 200 SMA and each day it stays down supports a more corrective market view.

Today the SPX appears to have broken out to the upside comfortably from an inverse H&S formation (closing at 1904.01). We will probably clear the 200dma tomorrow. Cross fingers!
 
Wow, missing a +3% move, I really thought it would flatline and not just bounce.....Oh well, tomorrow will be interesting.
 
Nice gap up on SPX today. We all know gaps get refilled sooner or later. I expect an ABC move up from the 1820 low, A-1820-1898, B-1898-1877 and now C-1877-1955 (for equality with wave A), or 1925 (0.618x wave A). This ABC move would be within a larger primary ABC move. When this first up-leg completes, I expect a retracement between 1904-1885 to 1889-1874. If you missed the first chance to get in, this will be the final boarding call. Patience is key here.
 
Nice gap up on SPX today. We all know gaps get refilled sooner or later. I expect an ABC move up from the 1820 low, A-1820-1898, B-1898-1877 and now C-1877-1955 (for equality with wave A), or 1925 (0.618x wave A). This ABC move would be within a larger primary ABC move. When this first up-leg completes, I expect a retracement between 1904-1885 to 1889-1874. If you missed the first chance to get in, this will be the final boarding call. Patience is key here.

Are you planning to sell at ~1950 and then wait for the retracement to get back in around 1890? Or ride it out?
 
Are you planning to sell at ~1950 and then wait for the retracement to get back in around 1890? Or ride it out?
Depends on timing and available ITF's. I expect a turn down and back up before months end so I will probably ride the trend because I don't have any ITF to give.
 
Depends on timing and available ITF's. I expect a turn down and back up before months end so I will probably ride the trend because I don't have any ITF to give.

Haha. Well, given your recent track record (amazing!!!!!) please by all means let those of us who do have an IFT left, when to get in once it turns down. :D
 
Back
Top