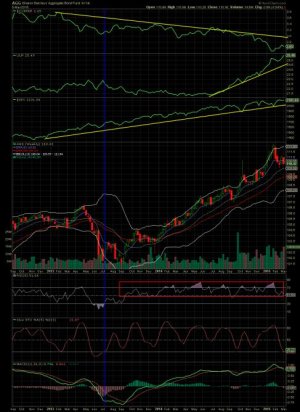
Hi DBAnnie: I agree that the movement of bonds is at times mysterious. I put up the AGG on the weekly chart below to aid this conversation.
View attachment 32740
The vertical blue line shows that the last time the AGG was really oversold was back in July, 2014 and has been rising ever since. Notice that the RSI below the chart in the red box has not really gone much below 50, so this is strength. What is causing it? Bonds are related to stocks, commodities and the US dollar, although not directly. To the right of the vertical blue line in the panels above the AGG chart we see SPX rising with AGG, the UUP (bullish USD) rising with AGG and Copper (surrogate for the metals or commodities) falling or inverse. From this chart we see an inverse relationship of bonds with commodities, an inverse relationship of commodities with the USD and a positive relationship of SPX with AGG. So right now, more than anything else, the run-away USD is pushing commodities to real low levels, which in turn is pushing up bond prices. As well, the positive correlation of SPX with bonds hints at inflation. There is way more to this intermarket analysis and I defer to John Murphy of Stockcharts for a technical discussion found here:
Intermarket Analysis [ChartSchool]


