Uptrend's Account Talk

I know I have taken a big break from TSP, but was remodeling my home, and something had to go. Have been following the market though and making some Stock trades. Just sold AUY (for now) and bought EBAY this AM (It is way oversold). The charts tell me that EBAY is a screaming buy. Zach's rating is a 3 (hold). It has come down more than 20% off its highs this spring.

On the TSP front, institutions have laid down big money on the buy side this AM, so I went back in from the sidelines (60% S and 40% C). My two non-stop models (NYSE and NASDAQ) are somewhat in disagreement: NYSE model on a sell, but improving and NASDAQ on a buy. These models have been highly reliable; especially when combined with money-flow. Sentiment is quite bullish now, so we shall see if that kills any further gains. Gold should pull back a little here, unless the Irag or Ukraine situations worsen and safe haven buying resumes. I also think the recent inflation perking up may be influencing the gold buying.


In short the market has mixed signals, so some caution is probably warranted. However, I am going with the big boys money-flow and my trend models.

Hey, good to see you back posting. Home remodel eh? Me too! Looks like I'll be plugging away at finishing family room, roof, and replacing siding after tear off for new picture windows this summer. Hope I can get it all done! But, hey, that's why I retired right?
 
I am just working on the bedrooms, tearing out the carpet and the casement trim and doors and putting in hardwood floors and oak doors and trim. I am addicted to the look of oak
 
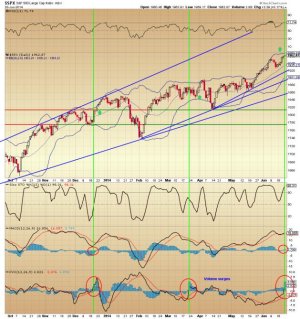
The SPX chart below, courtesy of StockCharts.com, shows a huge volume surge last Friday on the PVO (bottom indicator). This means that block trades from institutions were going crazy on the buy side. More than 1 billion was bought on AAPL for example. The chart also shows what happen the previous 2 times this happened; in December 2013, and March 2014. We see 5-10 days of gains with upward sloping Bollinger bands and overbought conditions pushing higher. The RSI is much stronger this time however, so that could mean a blow-off. We have SPX resistance at 1973 and then 2020. There is a chance of trading a little down or sideways first like the example in March 2014. However, IMO there was too much money injected into the market and the "movers" will move it higher,despite bullish sentiment readings. Gold should pull back right here and test 1300. Bonds should trade down, so the F fund might not be that great in the next few weeks.

My non-stop model for NYSE is on "buy" (from "sell") and my non-stop model for NASDAQ is on "hold" for last Friday, June 20. My models do not track the I fund. These models add confirmation that TSP C and S funds should enjoy further gains, and are currently rated as hold.

Some say that low interest rates are driving this market into oblivion. Others say that 2nd quarter rebalancing and window dressing is underway. Perhaps the "movers" are adding a few more pennies to their millions before they engineer a huge sell-off. I suppose right now they might be psychologically conditioning for the reckless retail investor -imagine that. Ok I am a guinea pig!

VolumeSurge.jpg
 
Mondays 5 point SPX range went basically nowhere. The bullish sentiment has started to pull back a little, but is still quite bullish. My non-stops models are on a buy. Gold is still overbought in the short timeframe and trading flat. Bonds look like a weekly sell to me. The USD is trading down and this is one factor that should support equities. Looks like the SPX is a little more than halfway through it's 80 day cycle. It did not reach a low when expected, so the cycle may be right translated. So, the high should not arrive for at least 6 more trading days and probably more like 10 days out.

I would like to tell you I know exactly what is going on, but just don't. Individual stock picks are a lot easier than Mr. Market. With the end of the quarter arriving soon, volatility may pick up as risky assets are dumped for more stable assets. This may favor the C fund.
 
The market is staying overbought and moving sideways. Still a good chance to approach SPX 2000 before July 7 to 8 which is my turn date based on cycle theory. The next big low should arrive during the first or second week of August. I still think gold will trade down below 1300 before long so not a good time to accumulate miners. Might even take out the last 1240 low but depends on geopolitical risk and inflation risk.
 
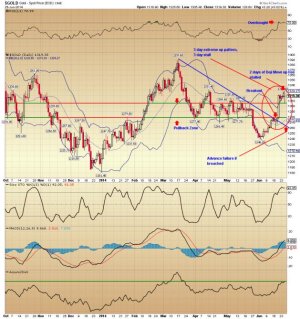
Gold analysis, courtesy of StockCharts.com. The yellow metal made a huge leap starting 6 trading days ago, but has stalled. Whether we have a lower high with bearish spacing or a reversal remains to be seen. There was a breakout near 1270, with an extreme 3 day price surge, followed by a 3 day stall. Has all the markings of a short squeeze followed by profit taking. The zone of interest is now 1306-1277. There has been one retest of 1306 (yesterday) but I would not call that a successful test. I would think if we get another bounce off this support, the gold market may continue upward in the short term. A more probable outcome in my view would be the 1277 level which is more in line with a 61.8% Fibonacci retracement. Any further decline, especially breaching the support line at 1260 or the recent low at 1240 should mean more downside. Gold markets are hard to figure and almost impossible to predict. So, my view is too wait for the set-up to come to you. Don't gamble and don't chase. A dollar cost average approach would be to enter a small position if a successful retest of 1306 area and add if daily close over 1322. If failure below 1306 and support at 1277, then take a small position and add when clears 1307. If 1377 and 1260 do not hold, then wait for a new low or double bottom.

My non-stop models for NYSE and NASDAQ are both on "hold" for TSP C & S funds.

Gold_06_25.jpg
 
The market advance seems unstoppable. However, there are signs of weakening with some negative divergences. SPX should be in the final ascent towards SPX 2000. Since sentiment is quite bullish and a turn date is identified this week (by me), I would expect a fall to the SPX 1956 area for starters. Whether the market goes to SPX 1989-2000-2019 levels now for the TOP, or goes and revisits a lower support or just starts a free-fall remains to be seen. As we know, anything can happen and what you least expect. My vote is a retest of 1956 and then a climb to the psychological SPX 2000 and then perhaps 2019 for the very top, but I am not sure Mr. Market is listening. Reasoning based on holiday week rises on low volume, indicates some profit taking the next (this) week, so I expect some red. I am looking closely at TZA, SPXU and VXX to initiate a possible short, but think we may be 1-5 trading days early. Waiting for the big thrust up day to take an opening position.

My non-stop NYSE and NASDAQ models on both still on buy & hold. However, I have jumped to safety of G/F. F is getting oversold now. Gold futures indicate a possible reversal (down) tonight, but gold futures can be unreliable. Mark Hulbert had an interesting article why gold should only be worth $800. Not sure I believe it, but fairly convincing at face value. If we all believe this, we should go out and buy up DUST. A double bottom is in play on the daily chart. near 16.20.

Gold might be up this year, but it
 
The downturn may be underway as I suspected (See post 3008). If SPX 1956 is taken out the next area is SPX 1897-1902, with 1926 a bump on the way. My non-stop NYSE model is now sell as of today (July 7), while the NASDAQ non-stop model hangs on the buy-hold. My market health indicator has turned negative, which is another reason I believe that we shall see a fall. Remember,1956 is the last stand to prevent more erosion. If 1956 should hold on a daily basis, then SPX 2000 and or 2019 is on the way. Since the signals of the non-stop models are mixed, we need to be patient until we get a confirmation.

Gold has been moving sideways. Meanwhile, the US dollar looks to want to rally. This should put downward pressure on gold, coal oil and other commodities.
What's not to like about tis market- perfect for high frequency flash traders and sucks for everyone else. A case of indecision.

Delta Airlines took a nasty fall today; something about Venezuela has prevented the repatriation of $4 billion in airline revenue, so Delta cut flights by 85%. Who wants to go to Venezuela anyway? I like the stock, and may be a buyer when the smoke clears.
 
The downturn may be underway as I suspected (See post 3008). If SPX 1956 is taken out the next area is SPX 1897-1902, with 1926 a bump on the way. My non-stop NYSE model is now sell as of today (July 7), while the NASDAQ non-stop model hangs on the buy-hold. My market health indicator has turned negative, which is another reason I believe that we shall see a fall. Remember,1956 is the last stand to prevent more erosion. If 1956 should hold on a daily basis, then SPX 2000 and or 2019 is on the way. Since the signals of the non-stop models are mixed, we need to be patient until we get a confirmation.

Good advice Uptrend! Yes patience is definately warranted. I keep track of daily closing prices for all the funds and track a 10, 20 and 50 day moving average. On the I fund, the 10 day moving average has fallen below both the 20 day and 50 day averages. On the F Fund, the 20 day has fallen below the 50 day. Not a good situation if you are invested in these two funds...
 
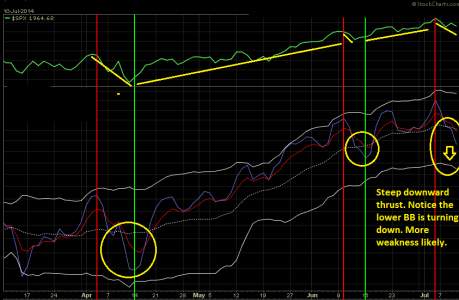
Are we there yet? Not. On timing, I think we could have a reaction off SPX 1956 and rally till next Wednesday-Thursday during options expiration. If so, it wont go far and be sideways to weak. I am projecting a low on or about August 1 and in the SPX 1897 region. Enjoy the nameless chart and the progress meter.

SPX_07_10_14.png
 
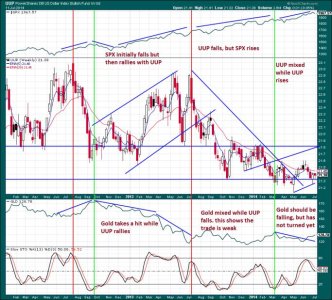
The US dollar looks poised to take off and climb. There is a low in May and a higher low in June. There is a positive cross on the stochastic. Does the US dollar have any relationship to the movement of the SPX in the last 2.5 years? What about gold? To find out I examined a weekly chart of the US dollar index bullish fund (UUP) with SPX in the upper window and GLD in the lower window. Here is what I found. (Oops I meant UUP mixed while SPX rises in the recent April -July chart area).

gld_uup.jpg

What this chart indicates is that there is no confirmed relationship of the US dollar with SPX. There may be an initial drop when the US dollar first rallies hard after a swift decline as seen toward the left side of the chart. However, there appears to be a very strong inverse relationship of the US dollar with gold. Anybody long gold?
 
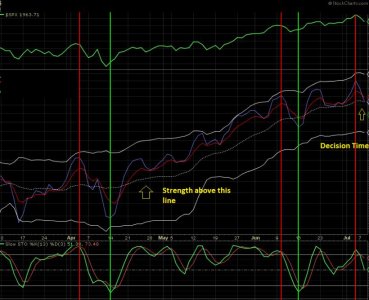
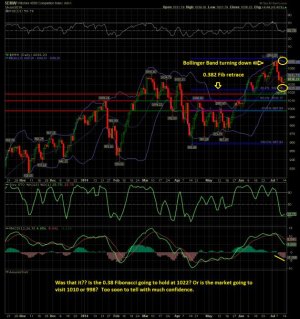
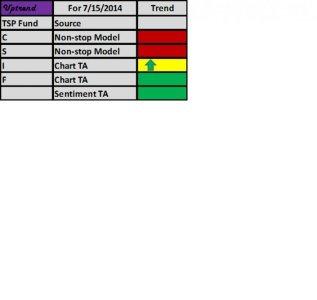
Could the markets have turned back up so fast? The Wilshire 4500 did hit a 0.38 Fibonacci retracement. But the upper Bollinger band is turning down and that is concerning. Plus my non-stop models are on sell. Sentiment is still too bullish which is bearish for stocks, but has cooled a fair amount. Gold did what I expected and should accelerate to the downside as the US dollar works its way higher. I am hoping for a good entry point into the gold miners when this down cycle starts waning (which probably won't be for a while). I make one round-trip from the June low, with pretty good results. I present my thinking for the TSP funds in the excel chart. Red means stay out, green is good (in) yellow is caution and directional arrow shows bias. The sentiment metric is contrarian sentiment. So, when green there are too many bulls and the market should decline. Keep in mind that the market can move against the prevailing trend (down is recent days) during options X week, so the market is not to be trusted.

spx_07_14.jpg

7_14.jpg
 

Attachments

  • 7_14.jpg
    7_14.jpg
    16.1 KB · Views: 432
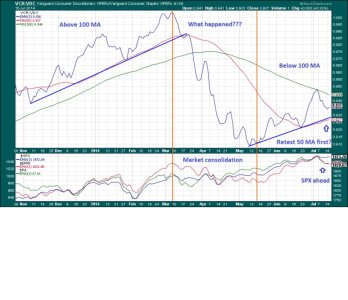
Today's chart musings. Presented is a relationship chart between consumer discretionary ETF (VCR) and consumer staples (VDC). The line chart is a 3 period EMA that smooths the data. Notice that discretionary stocks were leading during the early part of the year,then faltered with staples leading from March to mid-May and then discretionary leading again. However now the ETF has fallen below the 100 MA, that supported it the first part of the year. I have no idea why discretionary spending was less in the spring; and don't think you can blame the weather that was touted all winter. Though supported by the 50 period EMA, I am wondering if there will be enough strength to surmount the 100 EMA again. Will there be another retest of the 50 EMA first? Are you a bull or a bear? This analysis is suggesting a bullish outcome. In the lower panel I have the 3 period EMA of the surrogates representing the TSP funds and you can see that SPX is leading. This is supposed to be characteristic late in bull markets. Is this a fortune teller?

vcr_vdc.jpg
 
Back
Top