Uptrend's Account Talk

Not much is happening. Market action is somewhat typical for OX week. Based on my models it still paints TSP C and S funds as projecting down. The I fund still shows sideways action with a down bias (EFA chart). I am expecting the downtrend to resume in earnest, as soon as the week is over or even by sometime tomorrow or Friday. Watch carefully if SPX 1956 acts as support or is taken out. If it fails, as I expect it will, the market could fall as far as 1897. The upcoming EW should be a three, which is normally the steepest and longest down wave of a series. Gold is floundering around $1300 or slightly below and points down to the $1240-1280 area. Sticking to my G/F plan for now (G 60%, F40%). The reason I didn't go 100% F from C/S when I made a change a few days ago is because a combo tends to do better when the market is going sideways and I knew OX week could do just that. Sentiment is neutral (my methodology), but still with a bullish tendency (bearish for stocks).
sig_07_17_14.jpg
 
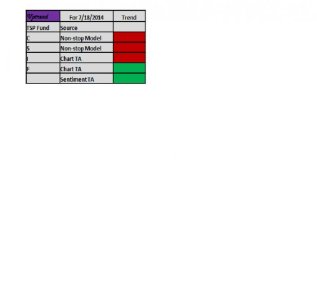
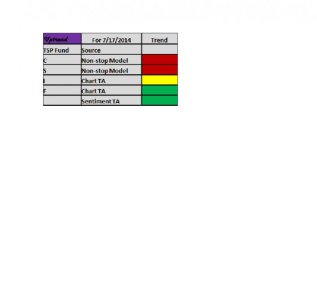
SPX came right down to the breakdown point at 1955, so it won't take much to push over the edge. A drop to 1930 should be coming and I think the ultimate wave extension will eventually land near 1897, where there is solid support. Political tensions or not, the market was ready for a breather and to consolidate a bit. The Ukraine crisis appears to be just a catalyst along the way. See ya at the bottom of the hill. Here is my TSP color ramp.

7_18_2014.jpg
 
As I look around the market data tonight, I don't see much to cheer about. All the internals I watch are down. In terms of strength to weakness of the TSP funds, tracked with surrogate measures, we have F, C, I and S. Since S is on the bottom, I conclude that some risk is being taken off the table. The US dollar appears to be gaining a foothold, so gold should be down this week as well as the SPX and general market should suffer - especially commodities. Geopolitical risk could make gold go sideways, but it will run into headwinds with the rising dollar. What's not to like about the F fund this week - looks like the place to hang out and twitter your friends. Ye old summer slump underway, and a reversion to the trend following a somewhat wild OPEX week. I may look more closely at future OPEX weeks for a TSP scalp trade, if an extra trade is anticipated to be laying around. The only situation I could think of is where you are already in F in a downtrend, hit an active fund for a day as the market overshoots up and then revert back. I suppose one could do the same, but in reverse in an uptrend. Still waiting for SPX to fail and take out 1956. Watch wave three show up.

For west coast sports fans, that was some wild major league baseball over the weekend with Mariners v Angels. 16 innings Fri, & 12 innings Saturday in LA. And the Angels are the best hitting team in the American League. But Felix Hernandez was there to slow them down. Mariners only came away with one win in the 3 day match-up on Saturday in the 12 inning game 3-2, while the Angels took Friday 3-2 and Sunday 6-5. Had to look this up, but "the longest game by innings in Major League Baseball was a 1-1 tie in the National League between the Boston Braves and the Brooklyn Dodgers in 26 innings, at Braves Field in Boston on May 1, 1920." Source: Talk:Extra innings - Wikipedia, the free encyclopedia
 
I was looking at the tracker and see that almost exactly 50% of the non-premiums that I will call the herd are still in the active C,S,and I funds. It doesn't matter if we look at the top 50 or the whole 600+ herd. Although not extremely bullish, it is more than I would have expected. Have we become desensitized to uprisings and sabotage goings on in Israel, Iraq and Ukraine? Or are we anticipating great earnings beats? My non-stop models are "clearly" on sell, and the market internals are not so hot either. And just enough bullishness to keep the roller coaster going. My sentiment indicator based on options is a little more neutral, but still negative. Safety sounds fine to me.
 
As I look around the market data tonight, I don't see much to cheer about. All the internals I watch are down. In terms of strength to weakness of the TSP funds, tracked with surrogate measures, we have F, C, I and S. Since S is on the bottom, I conclude that some risk is being taken off the table. The US dollar appears to be gaining a foothold, so gold should be down this week as well as the SPX and general market should suffer - especially commodities. Geopolitical risk could make gold go sideways, but it will run into headwinds with the rising dollar. What's not to like about the F fund this week - looks like the place to hang out and twitter your friends. Ye old summer slump underway, and a reversion to the trend following a somewhat wild OPEX week. I may look more closely at future OPEX weeks for a TSP scalp trade, if an extra trade is anticipated to be laying around. The only situation I could think of is where you are already in F in a downtrend, hit an active fund for a day as the market overshoots up and then revert back. I suppose one could do the same, but in reverse in an uptrend. Still waiting for SPX to fail and take out 1956. Watch wave three show up.

For west coast sports fans, that was some wild major league baseball over the weekend with Mariners v Angels. 16 innings Fri, & 12 innings Saturday in LA. And the Angels are the best hitting team in the American League. But Felix Hernandez was there to slow them down. Mariners only came away with one win in the 3 day match-up on Saturday in the 12 inning game 3-2, while the Angels took Friday 3-2 and Sunday 6-5. Had to look this up, but "the longest game by innings in Major League Baseball was a 1-1 tie in the National League between the Boston Braves and the Brooklyn Dodgers in 26 innings, at Braves Field in Boston on May 1, 1920." Source: Talk:Extra innings - Wikipedia, the free encyclopedia

Yet the market continues to go up?
 
Yet the market continues to go up?

That is because folks are buying crazy stuff like GoPro (ticker GPRO) Now trading at 80x earnings. Yeah that is a real bargain. Barclays is out there buying shares for you right now.

images
 
That is because folks are buying crazy stuff like GoPro (ticker GPRO) Now trading at 80x earnings. Yeah that is a real bargain. Barclays is out there buying shares for you right now.

images

Hey I agree with you. But I have been wrong for six months and am wrong today.
 
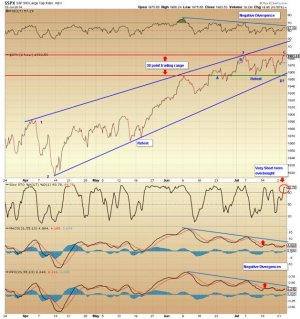
First a line chart of SPX 2 hr period:
spx_07_22_14.jpg

Here is what I am looking at:
1) Negative divergences (price moving higher while indicators declining)
2) Stochastic Momentum is short term overbought
3) 30 point trading range (1955-1985 approximately)
4) Above 1984 that is sustained would result in a "buy" and my non-stop models would probably flip
5) Failure below 1955 that is sustained would result in a continuation of the "sell" status


Additionally my non-stop models are on "sell." My sentiment analysis still results in a "sell" status. The EFA, as a surrogate for the TSP I fund, is tracing a declining triangle pattern (bearish). The AGG, as a surrogate for the F fund, has more room to run in the daily time-frame, with an RSI currently near 64. We need to see this reach 70 or above first. UUP, as a surrogate for the US dollar is now overbought in the daily time-frame, but not in the weekly time-frame. This should put pressure on the downward price of gold and commodities. However a down market could somewhat neutralize this effect, if the market were to falter from here.

Large caps have now been outperforming the small caps for about a month. This divergence could spell trouble down the road. It may be showing that traders are getting more defensive. It could also be a sign we are nearing the end of the bull market. I still think it is possible to reach 2020 or higher, but as I mentioned earlier Mr. Market needs to decisively take out the all time high near 1984 first in a continuation.:)
 
The market is still in a trading range I mentioned yesterday. The SPX is at the upper extreme, with perhaps a breakout, but has not been confirmed yet. Today's 1989 high bested the previous 1985 high with a 1987 close. Now it has to stay up there or else it is a fake-out. My non-stop models for C and S are still on "sell". The I fund is a "sell" as well and the F fund is still a "buy". The weekly gold chart points down, while the US dollar is still showing strength. The market could be consolidating for another push higher or about ready to roll over.
 
The futures were off quite a bit this AM, but have recovered a bit. Long term bonds sold off heavy yesterday, but have bounced back today today. Not sure why they are jumping around. Gold is still weak, and I think it will go lower as a trend. The US dollar is still gaining strength. All my models and chart TA are "sell" The F fund is OK but bonds are now just starting to get into the overbought zone. But, remember overbought can go for for quite a while, so that by itself doesn't mean much. The weird movements in the long bonds give me some pause, but it didn't seem to affect the F fund yesterday. Will be interesting to see what closing prices today are like.

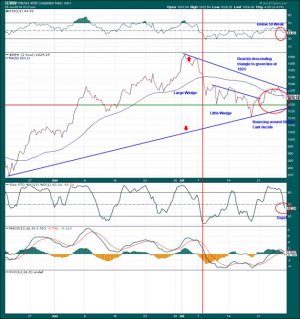
Below is a 2 hr chart of the W4500 (Wilshire 4500), representing the TSP S fund, with explanations on the chart. Weakness still abounds, but there is a big wedge forming which could break either way. Also the market is above and below the 50 ma and just can't decide.

emw_07_25_14.jpg
 
Briefly: I have a buy signal for the TSP C fund and the I fund, while the F fund is a sell. The S fund is still a sell. A strong sell-off on Tuesdays open will reverse this signal, otherwise it continues. Signals are generated in the daily time-frame, after the close for a trading day and are based on market technical internals, money-flow and sentiment. Sentiment is now at a bullish extreme and should turn bearish (bullish for stocks). There is an approximately 30% chance of this signal being wrong at this entry, but should be either confirmed or denied within 1-2 trading days. There are no absolutes in trading, as you know, but only probabilities. Market manipulators can fool charts in the short time-frame, but not the long time-frame.

The US dollar is now overbought in the daily time-frame and it now has a a negative tilt. This should help the I fund. EFA is on solid support and the RSI is 49, but the MACD is almost ready to make a positive cross, which shows momentum is up. The SPX internals are either slightly negative, flat or improving depending on the indicator. The S fund and Wilshire 4500 however still look sick and the internals were deteriorating today. The NASDAQ also looks sick. so it is a divergent market, where the safety of large CAPS is being bought or held, presumably to lesson risk. Divergent markets call for an increased level of prudence. I may take a swing at the C fund and perhaps I can hit a fastball if it is less than 90 mph! Please don't throw me a slider. Good trading to all.
 
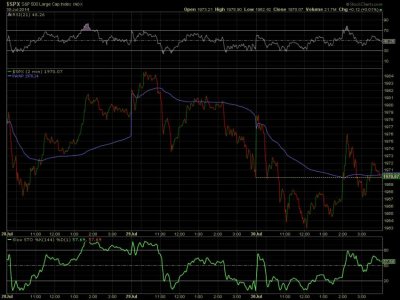
Morning update for SPX 60 minute period. Still in the channel. 1956 is support and my current trade will exit if that line is breached.

spx_7_30_14.jpg
 
The market has been acting a little weird and wacky the last few trading sessions. For example the SPX, is tracing out minute waves where directional trend is almost impossible to decipher. Well volume weighted average price (VWAP) can help. You can think of VWAP as an average price that starts fresh each day based on averaged tick data grouped into periods (ignore the wild jumps near the start of a trading day-doesn't mean anything). Since Monday the SPX has stayed in a 20 handle something range (boring) being generally above VWAP on Monday and below on Tuesday and most of Wednesday except near the end of the day. You never want to buy any security above VWAP and you always want to sell above VWAP when possible. At the end of a trading day VWAP approximates the 360 minute moving average. Tomorrow will be another VWAP experience.

SPX has adequate strength and could climb, but Wilshire 4500 and Nasdaq are still weak. And EFA is weakening again. The USD needs a short term reversal soon as it is quite overbought. My sentiment meter turned bearish today, which might mean bullish for stocks for a few days? Elliot waves are hard to count right now and EW technicians I follow have no real clue. It is not real unusual, but not generally true either that equities and bonds trade in the same direction as they did Wednesday. They usually are inverse. So what the xxx is going on? Gold is under 1300 now, but a USD slide should change that.

spx_7_30_14A.jpg
 
I have a solid buy signal today for C, S & I. My last signal in July was a miss, but I held anyway, because expected a bottom. Now we shall see where the market goes. The USD is still overbought and should fall a bit, helping the I fund. There is a divergence with gold and silver, with silver weaker. I think this means that gold may be in for a nasty fall, once the geopolitical tensions lesson a bit. The hated "dirty energy" coal is looking like it wants to make a comeback (BTU, ACI, CLD) and may be a good contrarian play right now. For large cap GE, INTC & NXPI are good choices IMO. More summer vacation to come - trade safe out there in TSP theme park.
 
Haven't posted on your account talk thread before, but appreciate your analysis and posts. Despite a July miss, it takes courage to take a position publicly.

I have a solid buy signal today for C, S & I. My last signal in July was a miss, but I held anyway, because expected a bottom. Now we shall see where the market goes. The USD is still overbought and should fall a bit, helping the I fund. There is a divergence with gold and silver, with silver weaker. I think this means that gold may be in for a nasty fall, once the geopolitical tensions lesson a bit. The hated "dirty energy" coal is looking like it wants to make a comeback (BTU, ACI, CLD) and may be a good contrarian play right now. For large cap GE, INTC & NXPI are good choices IMO. More summer vacation to come - trade safe out there in TSP theme park.
 
A new market rally is underway. There is a failure risk when these uptrends start, but the risk diminishes greatly after the first few days. So far, my non-stop models show that there is no failure and all the relationships are lined up and behaving properly. The EFA (I fund) chart is particularly oversold and turned positive, so I am thinking about increasing my position in I. This also lines up with the US dollar which finally appears to be topping, so any slide for a few weeks should boast the I fund. Gold is taking a big hit as I expected, when I saw the gold/silver disparity then other day. Some of the basic materials like steel have been on fire (X for example). Just picked up some GGB, as it is near the yearly lows and the sector is getting stronger.
 
Update:
The market knee-jerk reaction this AM with the Ukraine hostilities appears to be little more than profit taking in the markets and not a geopolitical meltdown on risk. Sentiment on Europe is quite negative, so the contrarian in me views this as a positive. Further, as I stated previously today, the EFA weekly chart looks very oversold and wants to run higher, so IMO this may be a buying opportunity for the I fund. Yes, there is some risk for Europe to slip back into recession, but the charts say otherwise. Europe does need to solve their energy dependence on Russia. In summary, the buy thesis for all markets is intact and the SPX reversal level is approximately 1930.

IMO, don't listen to all the emotion and news hype on CNBC, but look at the charts and fundamentals. Their insane analysis, based on limited information, got so bad I had to turn them off! If you followed some of their advice you would be exiting all your equities long positions and loading up on bonds and gold. I found it amusing that they could not explain why gold was making only a very muted rebound today after falling hard. Could that be because there is little inflation risk because market traders do not believe that the FED will hike rates anytime soon? Janet Yellen talks like a dove and I have seen nothing hawkish. The job market is not all that stellar and that is a primary inflation factor if hiring would ramp up. Looking around the news world I see more layoffs. Forget the fast food industry or Walmart disgruntled employees wanting to unionize - this is just ridiculous! This would lend support the weak dollar theory and the UUP charts have been topping in the near term. All this adds up to a possible surge in the I fund. BTW, the weekly EFA stochastic does not have a positive cross yet, but is definitely bottoming. As well the ROC (rate of change) has stopped steeply falling and is now going sideways. So a turn is not far away - probably in a 1-2 week window IMO. I am wondering if the US markets will lead and then Europe will follow?

Perhaps Obama should use the red phone and tell Putin to stop flexing political muscle in Ukraine. Not getting too many points in the world with his strategies. Ok, I am done rambling.
 
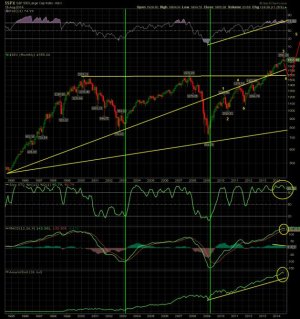
I would like to share with you some views at a "macro scale" of where I think this market is going. Sometimes I feel like I am in a flat land forest in the far north and it is difficult to see the forest for the trees. Too bad Google earth wasn't available! Anyway, I use a 20 year monthly SPX chart, courtesy of Stockcharts, to get an idea of Elliot waves, and more importantly support and resistance areas. Some basic rules: 1) the longer the trendline the more important it is, 2) the more times a support or resistance area is touched the more important it is, and 3) market extremes are important. The past tops of 1553 and 1576 set a slightly upward sloping trendline that is currently around the 1600 level. Any significant pullback would certainly test this level. Looking to the waves, several interpretations are possible, but the one I favor is the way I have labeled the chart. I believe the market is near the top of wave 3. A powerful reason for this is because (in EWT in an up trending market you have 5 wave sets, with 3 waves advancing and 2 declining) by rule two advancing waves are about equal and one is longer; usually the third wave. Wave 1 was 667 to 1220 or 553 points. Wave 3 has already exceeded a Fibonacci relationship of 1.618 x wave 1 that should have landed at 1906. Instead the SPX kept climbing to 1991, which is the next Fib multiple or 1.769 wave 1 landing at 1989. So 1991 is real close!

So, here is a possible scenario for you. Since wave 3 rally was extreme and surpassed the normal EWT metric (1.618 x wave 1), we are in last legs and form a double top in the 1991 area. Then the market surprises and dips away to the 1600 area. This is wave 4. In EWT and Fib terms. 1991-1600 = 391 and 391/980 (wave 3 advance) = 0.398 retracement or close enough to the typical 0.386 pullback that would be expected in an ongoing bull market. Of course all is not lost, as wave 1 should equal wave 5 more or less. If the 1600 area holds support the SPX will then continue upwards in wave 5 to near 2153. This also lines up with my projection of the long bull market from 2009 to be ending in 2016. Do I know if this scenario will play out? No. But I am real sure that 1600 and the previous market highs will be tested again. Just something to keep in mind.

spx_08_17.jpg
 
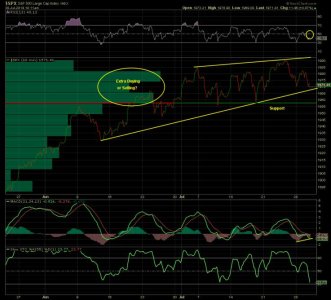
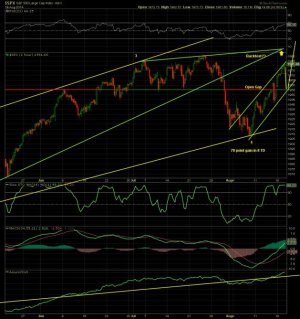
The SPX appears to be overheated, blasting 78 points in eight sessions and needs a little pullback IMO. MY non-stop trend models for C & S are still in force and have not moved off the buy side. If you look closely at the 2hr. chart below, you can see an unfilled gap near 1955. This is also horizontal support and fits nicely in the channel I have drawn. The candles in the last 6 hours on Tuesday are progressively smaller and smaller, so the strong momentum is evaporating. All told, I think an approximate 26 point pullback from current levels may be next, before continuing up. No market goes up or down in a straight line. There is further overhead resistance as I show on the chart and usually a consolidation occurs before busting out important levels such as the recent all time high. I don't expect to be on the sidelines long. Futures for Wednesday are slipping slightly by the hour. Wednesday could be a doji indecision type day or go a little higher before bouncing down to the other side of the rising channel. Anyhow, I think it is coming.

spx_08_19_14.jpg
 
Back
Top