Tsunami's Account Talk

Nice work TS and quite interesting....Are you planning to jump back in this month?

FS

Nope, I can't (used my two IFTs already and got out one day too soon to get that big gain last week) plus my system says to just stay in G for now. Maybe it's sniffing out something I'm not seeing fundamentally, but there are still plenty of TA warnings and I don't think you and DBA made a mistake bailing out today. This thing for example looks ominous:
https://northmantrader.files.wordpress.com/2014/04/bpspx54.png

...or perhaps this butterfly has wings:
http://www.61point8.com/Portals/0/article images/20160516/20160516SPY1.png
 
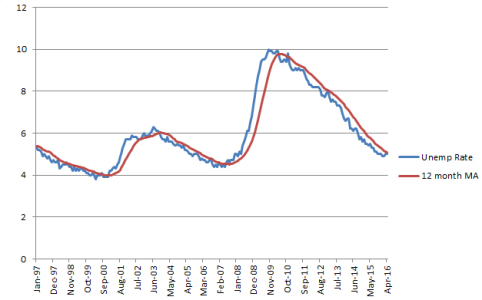
Cactus, thanks (I hadn't seen what you did since I almost never venture out of the account talk forums), I'll look at that this evening. At first glance it looks like we're using different data sources. I used the FRED graph for the UE rate which was linked in this article:

In Search of the Perfect Recession Indicator | PHILOSOPHICAL ECONOMICS

I used this: https://research.stlouisfed.org/fred2/graph/?g=3wSg

But with a quick comparison it looks like the numbers match...when I first looked at this I found that a tick up to just 5.1% for the May report will trigger a sell signal, but then I did my spreadsheet it said no, 5.4%...maybe I screwed up and will relook...and I might PM you and send you my data. I want/need to be sure I'm doing it right so will relook at it. I also like your chart and would like to add that to the tab on my spreadsheet for a visual of this indicator.

Looking at today's market....still undecided, yesterday's peak may have been just a wave 2 and now it's starting a wave 3 down...or not...don't know but at some point soon it's got to really bust out one way or the other. One other note is that the lunatic trader's "LT wave" for May peaks today. I'm comfortable sitting on the lily pad for now.
 
Tsunami, Thanks for the link to the follow-up article at philosophicaleconomics. It sounds like the Unemployment Rate has been a leading indicator recently so the latency shouldn't be an issue.

I went ahead and posted the spreadsheet of the numbers I used over in the Unemployment Rate System thread if you want to compare numbers. Let me know if you find any mistakes.
 
I’m not surprised by yesterday’s rally, and my guess is it has more room to run next week. There’s room under MJR’s dome chart to run up to about 2100 (and to MJR, GREAT chart and analysis this morning on the P/E ratio (any chance you can post a permalink to it?, I’d like to bookmark it), I’d “like” it twice if I could, it supports my view that once we (maybe) get just one more last gasp high out of the way near 2100 it’s going to be an ugly summer/fall for stocks), which would produce yet another lower high since the 2135 peak a year ago. This would make Peter Adams a perfect 2 for 2 on predicting both the low this week and the next high in a week or so if this pans out:
http://precisionsymmetry.com/wp-content/uploads/2016/05/spx-11.png
Two indicators that supported a rally was the lowest bullish sentiment since the February low at just 19%:
http://www.aaii.com/sentimentsurvey/sent_results
...and the NYMO oscillator being at an oversold level that has produced rallies:
http://stockcharts.com/public/1172710/tenpp
My guess is more upside until the NYMO peaks around the zero line, and the S&P somewhere around 2085-2102, then down we go again as the fear of rate hikes and Brexit picks up again. Meanwhile, as Ravensfan’s charts show, the G fund is showing its usual seasonal strength for May/June. This has been a really strong year for seasonality.
 
Back on 4/25 I posted a link to Gunner's latest free forecast for the S&P 500, in which he predicted that the S&P had at peaked at 2111 and would next fall to about 2022.5....he missed it by only 3.4 points. Now in today's post 22052016 he's predicted the rally will continue to 2083-2101 (maybe after first closing the gap at 2040 tomorrow), with 2101 being his primary target (and I'll go with Tuesday June 7th as a guess, when a small rally after the 6/3 jobs report runs out of gas...and maybe Apple will even close it's gap from 4/26). That 2083-2101 range almost exactly matches what I predicted yesterday...we could be twins, but I'm the twin that writes a little better.

What comes after that?...he goes on to say if the S&P can't close June above 2096 then "some enormous down forces can be unleashed" and 2111 could end up being the high for 2016....which also matches my expectations....or, a "monster upwards thrust towards 2500". Hmm.
 
I'm finally starting to back off from my bearish stance. If the S&P can clear 2111 then I could see this view panning out:
http://www.cnbc.com/2016/05/26/sp-500-could-hit-2600-next-year-but-pullback-comes-first-analyst.html

Perhaps a dip down to ~2000 first to complete wave C of and ABC (wave 2) correction, then blast-off into wave 3 into year-end...then peak around 2600 next spring. That would match Martin Armstrong's view that a final melt-up top is coming...and it would match how the unemployment rate is not yet signaling and impending recession. So blast way, fine with me, that would let me move up my retirement to as soon as next March.

Thanks TS, I like the scenario (will have to read the article later, CNBC hasn't been coming up at work last few months. You think there is a case to, dare I say it..., buy and hold through next spring? Of course, there will be fluctuations... thoughts?
 
Thanks TS, I like the scenario (will have to read the article later, CNBC hasn't been coming up at work last few months. You think there is a case to, dare I say it..., buy and hold through next spring? Of course, there will be fluctuations... thoughts?

Breaking the April high of 2111 is key. I think there would likely first be a pullback, like the guy in the CNBC video says maybe to around 2000 in mid- to late-June (which is also near the 200sma at 2010...so I'll go with 2010 as a guess)...then if it turns back up with some gusto and breaks 2111, you'll see me go into Birchtree mode....although 2600 may be wishful thinking. Until 2111 is broken though, that scenario is not quite 50/50 odds in my book. It just depends on whether investors get spooked by the long term indicators turning down sooner (like, next week) or later (next year)...
Charles Bolin's Detailed Investment Outlook - Market Topping, Economic Data in Decline | Charles Bolin | FINANCIAL SENSE
 
One can never have enough charts to stare at. Here's some more: 1 Think Tank Charts 2 - David Larew - Public ChartList - StockCharts.com

One thing that caught my eye at the close today....the transports are sitting on the lower Bollinger band, in the same spot as just before the big nosedives last August and January. Also, those panics were five months apart, and now here we are five months later after the January dive. So, if that cycle repeats, the next two weeks have the potential to get very ugly.

Not a prediction, just pointing it out. Odds are better that we're near a significant reversal I think, maybe down around 2042, the 200dma for the S&P.

$TRAN - SharpCharts Workbench - StockCharts.com
 
Well if I have my numbers right, this current LT red period is as follows through today's close.

C Fund -1.56%
S Fund - 2.57%
I Fund - 6.06%

Definitely not a good time to be invested.

 
Whoo hoo, I'm retirement eligible today! :banana:

Things area looking good for the markets. Those that have and will exit before the vote results are announced late Friday should add fuel to the rally next week as they re-enter. That's my hope anyway.
 
Yes, but can you afford to retire? That's going to be my sticking point in 2022. At the rate I've been going these last few years I will need to stick around another 5 years past my eligible retirement date to be able to afford retirement.
 
Congrats TS. It is a good feeling even if what Cactus says is true. I reached my MRA with 10 years 9 months fed time. So I was eligible. But not likely to leave. Still you always have that thought on bad days that you are eligible.:smile:

PO
 
Back
Top