tsptalk's Market Talk

Small caps are leading this morning, on the hopes of more financial bailouts for the banks. But it's the S&P that has been forming, at this point, resembles a "V" bottom, although it is struggling with the 200-day EMA again this morning.

Yields are up as the 10-year again bounces off its 200-day EMA, and that means weakness in the F-fund to start the day.

Big week ahead with the two-day FOMC meeting starting tomorrow.
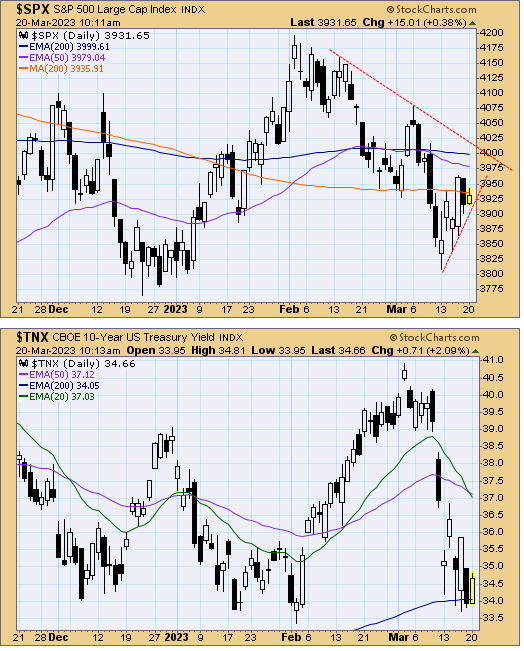
tsp-032023a.gif
 
Busy morning. Nice gap up rally to start the morning with some backing and filling since, although the gap is still open. Lots of overhead resistance in the S&P and if I had to speculate, the Fed's decision tomorrow will make or break the +/- 4000 area.

tsp-032123b.gif


Small caps are leading as the bailouts keep flowing. Perhaps this is containable... or is it the tip of the iceberg?
tsp-032023b.gif

Cool, if we pop up tomorrow, I'm bailing, better to be first to leave the party, then the last one who drives the drunks home :)
 
Slow day of trading before the Fed announcement on interest rates at 2PM ET. Small caps are lagging again, but otherwise we are seeing a lot of flat action.

The dollar and yields are leaning lower but again, fairly flat.

We have some very interesting set ups in the index charts as many push up again resistance so we should either see a breakdown, or a major jump higher. It seems unlikely that things would stay flat. That is unless all of the estimates are correct and everything is priced in perfectly already. Even then, traders will push and pull and give us some volatility.

This chart looks particularly compelling. High Yield Corporate Bonds / credit market indicator.

tsp-032223a.gif
 
Last edited:
A few minutes before the close and the charts have been doing a really good job of calling the shots. The bear flag on the small caps may be the most disturbing.

tsp-032223b.gif
 
There's a very mixed picture on this chart with some short-term upside momentum off the March 13 low, but stiff resistance near yesterday's highs. It also bounced nicely off the 200-day SMA (orange average) and it is already back testing the 200-day EMA (blue.) The PMO indicator on the bottom is about to crossover its moving average, similar to the early January cross before the rally.

tsp-032323a.gif


The S-fund chart looks bad, but bear flags haven't been breaking down so it's no slam dunk sell, even though it looks like one.

tsp-032323b.gif


The I-fund nears overhead resistance, however it still has sort a bull flag look to it, if we just ignore the banking crash. :)

tsp-032323c.gif


Mixed signals, for sure.
 
The S-fund chart looks bad, but bear flags haven't been breaking down so it's no slam dunk sell, even though it looks like one.

Getting dicey here in the S-fund with the red bear flag breaking. The blue lines represent some hope that it is still a sideways consolidation.

tsp-032323d.gif
 
High Yield Corp bonds are struggling a bit here. Could be a tell, but nothing too serious yet. Just a little underperforming of the S&P 500.

tsp-032823a.gif
 
Some roadblocks, some potential targets. Another gap to fill below.

tsp-032923a.gif


Another pop higher in yields, but the 10-year continues to flounder in the bearish flag.

tsp-032923b.gif


Small caps too. Probably due for some relief but the bear flag persists.

tsp-032923c.gif
 
The bulls are fighting through some serious obstacles, both technically and fundamentally.

The Q4 GDP ticked down to 2.6%, just under estimates.

Jobless claim were a slightly higher than expected, but basically inline, so no concern for interest rates there and probably why yields are lower today. Tomorrow's PCE report may be more telling.

Transport broke above some recent high but it now testing its 200-day EMA.

tsp-033023a.gif


The S&P is trying to confirm the recent breakout and the trend is becoming the bulls' friend here, but the breakout opened another gap.
 
The S&P is trying to confirm the recent breakout and the trend is becoming the bulls' friend here, but the breakout opened another gap.

FYI, this morning's gap will be filled somewhere between 4,028 (yesterday's close) and 4,031 (yesterday's high.)

Today's low so far is 4032.
 
I thought this was interesting. Notice how in the current charts the S&P 500 is moving counter to the yield on the 10-year Treasury.

tsp-0331230117a.gif


Then go back to 2007 - 2008 and they were clearing moving much more in sync with each other.

tsp-0331230117b.gif
 
I thought this was interesting. Notice how in the current charts the S&P 500 is moving counter to the yield on the 10-year Treasury.

Then go back to 2007 - 2008 and they were clearing moving much more in sync with each other.

I swear, this market is totally disconnected from reality, I have no idea who's buying at these levels, at this point I'm starting to run out of things to sell. Perhaps some automated fund inflows are pushing prices higher on lower than usual volume.
 
Some selling to start the day will bring out both dip buyers and FOMO investors, and the bears who will claim the rally is over. It's too early to say who is right, of course. The market tends to move in one direction longer than we think is reasonable, but it also loves to fool the most people it can so a case can be made for both more upside that frustrates those missing the boat, or a quick reversal down to catch all those new bulls off guard.

Which will it be? :D

Yields and the dollar are falling hard again this morning. If you missed the list of what is happening around the world regarding the dollar, here the link...

https://www.tsptalk.com/mb/day-to-day-market-talk/40572-what-going-last-7-days.html?highlight=arabia
 
A little more pulling back this morning. So far there is no sign of a top on THIS chart, and there is plenty of support, but other charts are wobbling a little more. Small caps (S-fund) are down another 1% in the early trading.

tsp-040523a.gif


Yields are down again pushing to new multi-month lows. The "F" flag is testing a possible support area so well have to see if toady's lows, that 3.27% area, can hold today.
 
Not a lot of action this morning. Yields are down slightly, and the dollar is up slightly.

Regional banks are up, so the Russell 2000 is outperforming the S&P.

Gold and silver are pulling back after some big rallies.

Is this just a typical pre-holiday reversal that will reverse back up after the weekend, or has this week's weaker action changed the tone on Wall Street?

No really... someone tell me. :D
 
Back
Top