tsptalk's Market Talk

The 10-year yield and the dollar look like they want to go higher. TNX is building a right shoulder in an inverted head and shoulders pattern, and the dollar is looking to break above that F-flag - although the 50-day EMA is still in the way. Does that mean the market is bracing for a hawkish Fed this week? The probabilities are showing a good chance of a 0.25% hike.
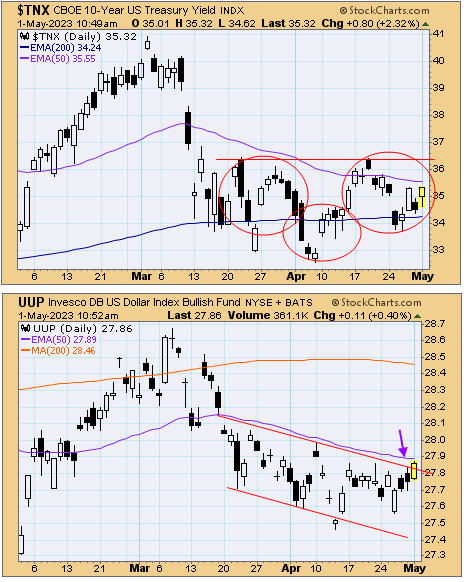
tsp-050123a.gif
 
Everything could change in the blink of an eye tomorrow after the rate hike and press conference, but today the dollar is breaking out of that F flag formation.

tsp-050223a.gif
 
More churning in the dollar and yields, and another fake out in the dollar. Is everyone confused about direction?

tsp-050323a.gif


The choppy dollar also has oil acting very wildly - also with fake outs on both ends.

tsp-050323b.gif
 
WHEN are they going to take my money from my Credit Union?View attachment 57999View attachment 58000

While you're sleeping! :D

My bank/insurance USAA reported their first annual loss since 1923.

The insurance and financial services giant reported a $1.3 billion net loss for 2022, according to its annual report, down from a $3.3 billion profit in 2021, and just over $36 billion in revenue in 2022, a 3% decline from last year.

"[FONT=&quot]Investment returns declined by 44%, “driven by the absence of large prior-year investment gains and weak equity market performance,” stated the report."[/FONT]
 
Job growth totals 253,000 in April, beating expectations even as the U.S. economy slows

Nonfarm payrolls increased 253,000 for April, beating Wall Street estimates for growth of 180,000.

The unemployment rate was 3.4% against an estimate for 3.6% and tied for the lowest level since 1969.

Average hourly earnings rose 0.5% for the month and increased 4.4% from a year ago, both higher than expected.

https://www.cnbc.com/2023/05/05/jobs-report-april-2023-job-growth-totals-25300-in-april.html

With Apple up and being so heavily weighted in the major indices, the market has a string bullish catalyst today. The regional banks are also up big this morning so the small caps can come along for the ride.

But those jobs numbers are too hot to keep the Fed happy. The market was due for some relief after 4 down days, but the Fed is making note. Right now the market is pricing in just a 3% chance of another rate hike in June. I'm going to keep an eye on that because after a big beat in jobs created and a decline the the unemployment rate, we could see that number move higher. Yields are up this morning on this data.

tsp-050523a.gif
 
The opening bell filled yesterday's open gap (blue) but created another - this one a stealth gap because it's tougher to see. It goes from yesterday's close to today's open (red.)

tsp-050523c.gif
 
KRE regional banks ETF is jumping this morning, but it is also just filling in yesterday's gap so far.

tsp-050523d.gif


tsp-050523e.gif
 
Stocks are flat to slightly lower this morning. Friday's overzealous rally may need to some backing and filling before we see a breakout. You can see prior 1 - 2 day rallies and most of them tend to see some kind of retracement of those big candlesticks. Even if they eventually continue higher, retracing helps firm up the charts by weeding out profit takers. The question is whether dip buyers eventually show up or not after the retracing, and over the last few months it has been hit and miss, but obviously being near the highs for the year, the bulls have been winning the battles.

tsp-050823b.gif


Yields are up again today with a small gap up on the 10-year. I have been highlighting the inverted head and shoulders pattern on this chart in my commentary. Here it is starting to look more like a successful test of the lows, but also possibly a bear flag. 33 and 36.50 look to be the lines in the sand.

tsp-050823a.gif

tsp-050823d.gif
 
The indices are doing a typical job of retracing Friday's big candlestick.

tsp-050923b.gif


Small caps and the I-fund are lagging slightly with the regional banks pulling back again, although potentially just filling in that small gap. It's not a good looking chart for sure, but whichever way it goes, filling that gap helps.

tsp-050923a.gif


The dollar is off and running as the back and forth continues on this chart, and we have another breakout effort up to the 50-day EMA.
 
Which side of the cup and handle resistance line will this close on? Old resistance can become support, but there are still open gaps below the resistance line.

tsp-051023a.gif
 
The regional banks are dragging down the small caps again. Maybe the IWM just needed something to help fill that gap? :)

tsp-051123a.gif
 
Yields and the dollar are up and that's adding some pressure to stocks this morning. Why the dollar is hitting a 7 week high, I don't know. There's an open gap above, and below.

tsp-051223a.gif


The S&P and EFA are down slightly but hanging abound their recent highs. Small caps look vulnerable again after failing at the 50-day EMA.

tsp-051223b.gif
 
Back
Top