tsptalk's Market Talk

Yields up, dollar down. That's a clear F-flag on the 10-year yield. F-flags tend to eventually break down, but they can stay in that flag a while before they do.
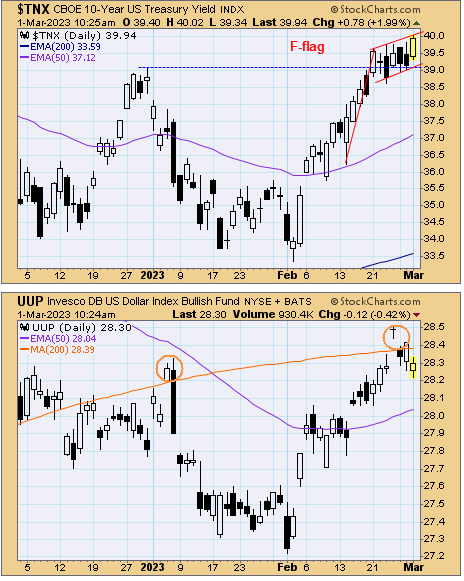
tsp-030123b.gif


The dollar is back below its 200-day average and the decline has the I-fund up nicely this morning.

Small caps are flat early, while the S&P lags again.
 
The 10-year yields broke above its F-flag - yet another flag formation that broke in the opposite direction of what is typical. Thee is a gap, one of those stealth gaps that tougher to see on a chart) up near 4.15%. Otherwise, this may be looking to test the October highs.

tsp-030223a.gif


The dollar has been popping up one day, down the next -- today it gapped up and is now back above its 200-day EMA. There is a new gap above yesterday's highs.
 
I should have told you the Dollar was going to trade up strong today, since I did my monthly foreign exchange yesterday (on a down day)... :suspicious:
 
Some opening bell comments:

Stocks gapped up but we saw some sellers move in quickly. However, some of the recent flags that have formed seemed to have broken.

The 10-year yield started the day with an island reversal formation. Can it hold?

The S&P gapped above the flag I mentioned in today's commentary.

The Transports broke their descending channel yesterday.

The dollar is back below the 200-day average. If it can close there it would be the 7th straight day of flip flopping above and below it.

All that in the first few minutes of trading today.

tsp-030323a.gif
 
The Transports broke their descending channel yesterday.

The Transports are now down on the day. :scratchchin:

Not a game changes considering yesterday's big gain, but maybe a yellow flag.

Advance decline numbers look strong, but this breakout in the S&P MUST hold into the close.
 
The 10-year yield opened sharply lower but hit the December high, bounced and has since filled in the gap. There is another gap up by 4.05%.

Stocks are mixed with small caps lagging and large caps doing well. There's more upside room on the S&P 500 charts than the S-fund chart.

tsp-030623b.gif
 
From today's commentary"

The action certainly looks encouraging for the bulls, but today could be tricky. We've seen some fake outs, like the one in December where the breakout off the lows didn't last long and in fact quickly led to lower lows. Then, in early January we saw a similar Friday breakout from a consolidation, but the following Monday saw a major negative reversal. Now that one may have caused some panic selling when all of the big early Monday gains were lost, and then the following day the rally resumed. As I always say, "they", whoever they are, love to try to get us leaning the wrong way. Friday's bullish action probably will have mom and pop leaning on the bullish side to start the day, so will "they" do something to try to change that?

tsp-030623w.gif


tsp-030623d.gif
 
Last Friday a few people on Twitter said Zero days to expiration options (0DTE) were pushing the action up. Interesting the S&P reached 4077 three times already today but could not get to 4080. :smile:
 
The swings in the 10-year yield and the dollar, above and below support / resistance, continues. The 10-year is back below 4%, and whether it can stay there or not may determine if the rally in stocks can continue.

tsp-030723b.gif
 
Stocks are down again after a mixed jobs report that saw more jobs added than expected, but the unemployment rate went up to 3.6%. Revshark used a good term for what happened his morning report today when he said the Fed was blindsided by this trouble in the small banks, specifically the Silicon Valley Bank that was crushed yesterday, down 60%.

This may put the pressure on the Fed to back off of their extreme hawkish approach. Because of that, the S&P 500 is holding up OK so far, down modestly, but it's those small caps indices that are taking the brunt of this as they are littered with regional bank companies.

tsp-031023a.gif
 
Stocks are mixed but it's going to be a wild week so if you don't like what you see at any given moment, just wait.

The 10-year yield is all the way down to 3.5%.

Small caps are lagging (small banks stocks still a problem.)

Reminder - I am out of town and may be stuck in jury duty. Waiting to hear.
 
Yields lower to start the day (bonds open an hour before stock market.) Another test of the 200-day EMA. Another bounce? That is what the BND chart might suggest since bond prices move opposite to yields and the BND is in a bearish head and shoulders pattern filling out the right shoulder.

tsp-031723a.gif
 
Back
Top