I really expected to see a negative close today, but the market closed mixed instead, seesawing above and below the flat line.
Today's data points did little to stir trading and gives me the impression the market is more interested in Friday's nonfarm payroll report and unemployment rate before it makes any big moves in one direction or the other.
For today, the ADP report revealed 84,000 jobs were lost in December, a tad bit more than the 75,000 that was expected.
The December ISM Service Index bumped up to 50.1 from the 48.7 in November, but it was still below the 50.5 average forecast.
Even the FOMC meeting minutes, which showed some members feel more stimulus might be needed did little to move the market.
The dollar did give back the 0.2% gain from yesterday though, dropping by that same amount today.
I continue to think the market is ripe for some profit taking in at least the short term. The Seven Sentinels appear to be saying the same thing. Here's today's charts:
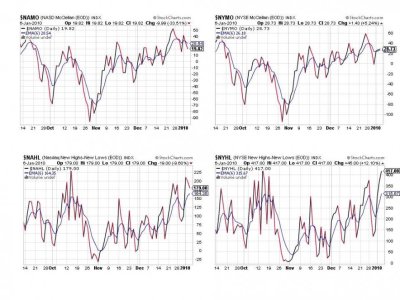
NAMO dropped further into sell territory while NYMO ticked up just a bit while remaining on a buy. NAHL dipped just a bit while NYHL pushed higher.
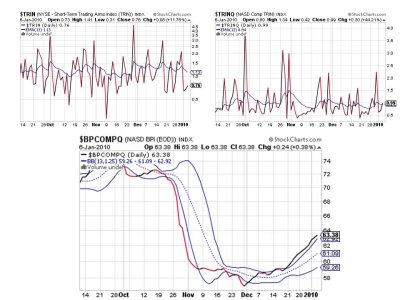
TRIN and TRINQ remained on a buy while BPCOMPQ continued to ebb higher in buy territory.
For new readers who may not be familiar with the Seven Sentinels system, here are the general rules:
NAMO, NYMO, NAHL, and NYHL:
A daily reading above the 6 Day Exponential Moving Average (EMA) is buy mode, and a reading below the same is sell mode.
TRIN and TRINQ:
A daily reading below the 13 Day EMA is a buy signal, a reading above the 13 Day EMA is a sell signal.
BPCOMPQ:
A positive signal crossing of the top or lower bollinger band constitutes a buy signal. A negative crossing of the top or lower bollinger band constitutes a sell signal. It stays in a buy or sell mode until it recrosses in the opposite direction.
For the system to issue a buy signal all seven signals must go to a buy concurrently. The opposite is true for a sell. A seven signals must go to sell mode concurrently. Once a buy or sell signal is achieved it cannot be reversed until all seven signals align in the opposite direction again.
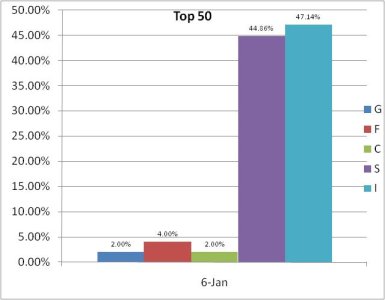
Here's the first data point for the new trading year from our Top 50. There's really not much to be learned from this expect stocks were the place to be the first week of January (so far).
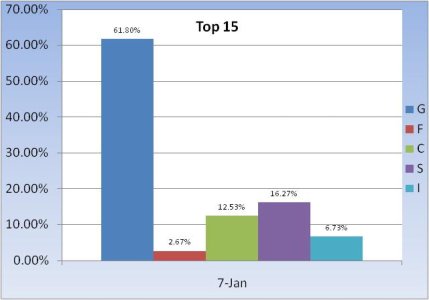
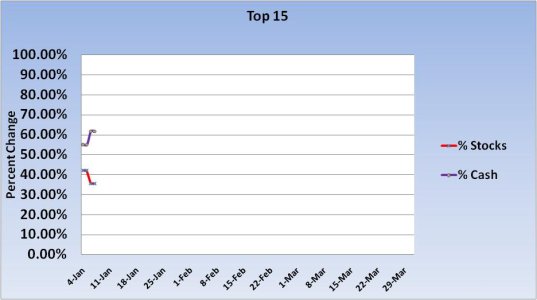
We did have some movement with the Top 15. They raised more cash. I'm glad I'm not the only one who thinks we're due for some selling pressure.
So the Seven Sentinels remain on a buy, but the charts continue to look toppy. I'm expecting some selling pressure to kick in any day now, but that's just my expectation. It also remains to be seen if the declines are going to be as fast and hard as the rallies, which is what we saw so many times last year.
I have been trying to predict buy and sell signals with the Seven Sentinels due to the extreme volatility we'd see on reversals and I have had a lot of success doing that. I certainly hope my chart reading continues to be successful in this new year.
Today's data points did little to stir trading and gives me the impression the market is more interested in Friday's nonfarm payroll report and unemployment rate before it makes any big moves in one direction or the other.
For today, the ADP report revealed 84,000 jobs were lost in December, a tad bit more than the 75,000 that was expected.
The December ISM Service Index bumped up to 50.1 from the 48.7 in November, but it was still below the 50.5 average forecast.
Even the FOMC meeting minutes, which showed some members feel more stimulus might be needed did little to move the market.
The dollar did give back the 0.2% gain from yesterday though, dropping by that same amount today.
I continue to think the market is ripe for some profit taking in at least the short term. The Seven Sentinels appear to be saying the same thing. Here's today's charts:

NAMO dropped further into sell territory while NYMO ticked up just a bit while remaining on a buy. NAHL dipped just a bit while NYHL pushed higher.

TRIN and TRINQ remained on a buy while BPCOMPQ continued to ebb higher in buy territory.
For new readers who may not be familiar with the Seven Sentinels system, here are the general rules:
NAMO, NYMO, NAHL, and NYHL:
A daily reading above the 6 Day Exponential Moving Average (EMA) is buy mode, and a reading below the same is sell mode.
TRIN and TRINQ:
A daily reading below the 13 Day EMA is a buy signal, a reading above the 13 Day EMA is a sell signal.
BPCOMPQ:
A positive signal crossing of the top or lower bollinger band constitutes a buy signal. A negative crossing of the top or lower bollinger band constitutes a sell signal. It stays in a buy or sell mode until it recrosses in the opposite direction.
For the system to issue a buy signal all seven signals must go to a buy concurrently. The opposite is true for a sell. A seven signals must go to sell mode concurrently. Once a buy or sell signal is achieved it cannot be reversed until all seven signals align in the opposite direction again.

Here's the first data point for the new trading year from our Top 50. There's really not much to be learned from this expect stocks were the place to be the first week of January (so far).


We did have some movement with the Top 15. They raised more cash. I'm glad I'm not the only one who thinks we're due for some selling pressure.
So the Seven Sentinels remain on a buy, but the charts continue to look toppy. I'm expecting some selling pressure to kick in any day now, but that's just my expectation. It also remains to be seen if the declines are going to be as fast and hard as the rallies, which is what we saw so many times last year.
I have been trying to predict buy and sell signals with the Seven Sentinels due to the extreme volatility we'd see on reversals and I have had a lot of success doing that. I certainly hope my chart reading continues to be successful in this new year.
