10/29/25
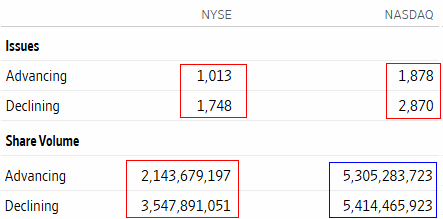
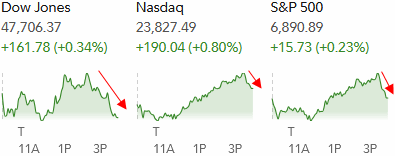
We saw a lot of green on the three major indices but internally it wasn't quite the positive day that they indicated. Small caps were down again, and they helped create a very negative market breadth for the day, despite the green we see below. Stocks also sold off into the close, perhaps due to the FOMC meeting today and large cap earnings coming out later today. Bonds were up as yields slipped further below 4%.
It was just one day but that market breadth was pretty bad on a day that looked so impressive - at least up until that final hour of trading. As I was getting this chart ready I heard someone say that the advance / decline line was the worst for the size of the gain in the S&P 500 since 1990, and the worst breadth (adv/dec) while at an all time high, ever. What that meant in 1990, I don't know, but perhaps the potential consequences of today's interest rate decision from the Fed and the Magnificent 7 earnings due later today had something to do with it.

Source
Microsoft, Meta, and Alphabet will be reporting after the closing bell today, and Apple and Amazon report tomorrow.
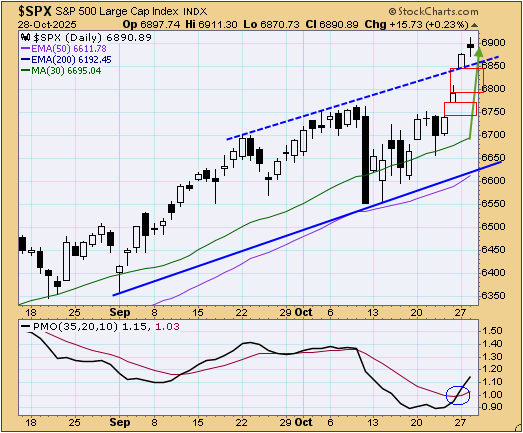
The S&P 500 (C-fund) chart is acting extremely bullish but it is clearly getting extended after the recent 4-day rally, and yesterday's spinning top candlestick meant a day of some indecision. the index hit 6911 at the highs yesterday and that was 200+ points above the 30-day moving average, 300-points above the purple 50-day EMA, and it closed about 700-points above the 200-day average. So, could we see a "sell the news" reaction to the Fed's rate cut today? The open gaps below suggest that is a possibility, but now that the index is above the channel, the top of the channel could try to hold as support.
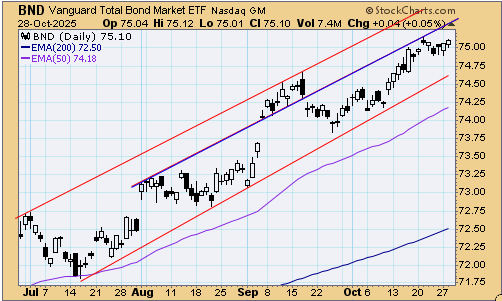
The 10-year Treasury Yield continues to trend lower with another push below 4% yesterday.
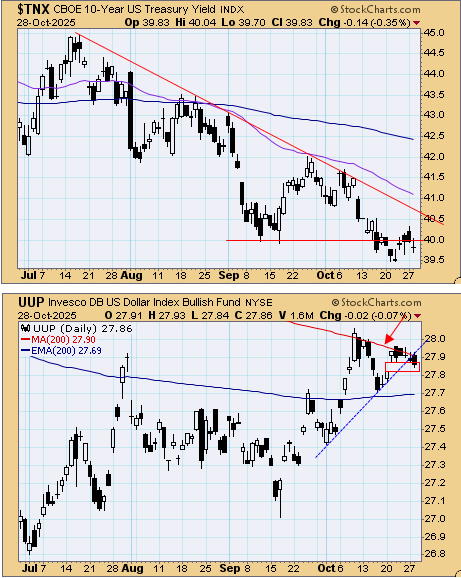
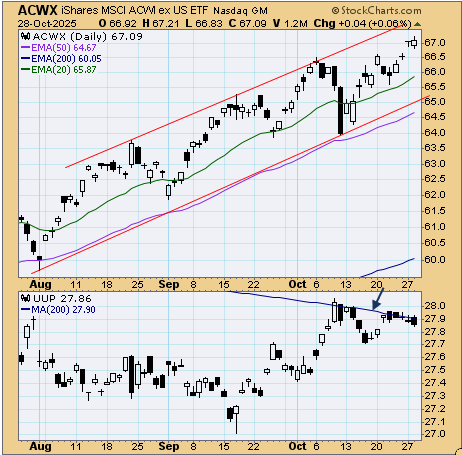
The dollar (UUP) has been sliding lower as well as it slowly tries to fill in that open gap, while continuing to respect the resistance of that 200-day moving average in red. This looks more like a consolidation. The Fed could push or pull this in either direction, but just looking at that consolidation and bullish looking flag on the chart, it may try to go higher.
The Federal Reserve will be giving us their decision on interest rates and the updated monetary policy statement at about 2 PM ET. There is a 99.9% probability of a rate cut today, and a 93% probability of a third cut in December.
S&P 500 has been down 4 of last 7 Fed FOMC rate decision days with an average loss of –0.48%, but it gained an average of +0.18% the day after, with 4 up, down 3. Not great numbers but over those last seven meetings, the Fed only cut the rate one time - in September. That day the S&P 500 was down, but it rallied for three days afterward.
We'll get the key inflation PCE Prices data data on Friday, and President Trump will be meeting with China's President Xi on Friday as well.
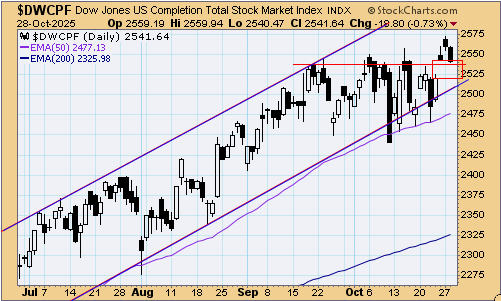
The DWCPF Index (S-Fund) pulled back sharply which contrasted with all the green in the big three major indices. But you can see here that it has just dipped back to test the breakout area. The bulls would love to see that red line hold, but filling the open gap and getting that out of the way would be fine as well - as long as the trading channel remains intact.
ACWX (I-fund) was up slightly and the chart is holding near those all time highs. There's still room above on the trading channel, but there is also a lot of room down to the bottom of the channel. There's an open gap near 66.50, and technically another one just below that, and filling one or both would be productive. Perhaps some volatility today will do the trick?
BND (bonds / F-fund) made another new high as yields continue to slide lower. It is possible that the Fed says something to send the direction of yields higher, which of course would push this chart down, but right now BND has a bullish chart trending higher, although there is some wiggle room on the downside in the short term.
Thanks so much for reading! We'll see you back here tomorrow.
Tom Crowley
Read more in today's TSP Talk Plus Report. We post more charts, indicators and analysis, plus discuss the allocations of the TSP and ETF Systems. For more information on how to gain access and a list of the benefits of being a subscriber, please go to: www.tsptalk.com/plus.php

Questions, comments, or issues with today's commentary? We can discuss it in the Forum.
Daily Market Commentary Archives
For more info our other premium services, please go here... www.tsptalk.com/premiums.php
To get weekly or daily notifications when we post new commentary, sign up HERE.
Posted daily at www.tsptalk.com/comments.php
The legal stuff: This information is for educational purposes only! This is not advice or a recommendation. We do not give investment advice. Do not act on this data. Do not buy, sell or trade the funds mentioned herein based on this information. We may trade these funds differently than discussed above. We use additional methods and strategies to determine fund positions.
We saw a lot of green on the three major indices but internally it wasn't quite the positive day that they indicated. Small caps were down again, and they helped create a very negative market breadth for the day, despite the green we see below. Stocks also sold off into the close, perhaps due to the FOMC meeting today and large cap earnings coming out later today. Bonds were up as yields slipped further below 4%.
| Daily TSP Funds Return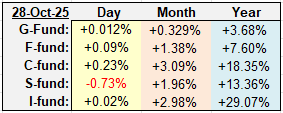
More returns |
It was just one day but that market breadth was pretty bad on a day that looked so impressive - at least up until that final hour of trading. As I was getting this chart ready I heard someone say that the advance / decline line was the worst for the size of the gain in the S&P 500 since 1990, and the worst breadth (adv/dec) while at an all time high, ever. What that meant in 1990, I don't know, but perhaps the potential consequences of today's interest rate decision from the Fed and the Magnificent 7 earnings due later today had something to do with it.
Source
Microsoft, Meta, and Alphabet will be reporting after the closing bell today, and Apple and Amazon report tomorrow.
The S&P 500 (C-fund) chart is acting extremely bullish but it is clearly getting extended after the recent 4-day rally, and yesterday's spinning top candlestick meant a day of some indecision. the index hit 6911 at the highs yesterday and that was 200+ points above the 30-day moving average, 300-points above the purple 50-day EMA, and it closed about 700-points above the 200-day average. So, could we see a "sell the news" reaction to the Fed's rate cut today? The open gaps below suggest that is a possibility, but now that the index is above the channel, the top of the channel could try to hold as support.
The 10-year Treasury Yield continues to trend lower with another push below 4% yesterday.
The dollar (UUP) has been sliding lower as well as it slowly tries to fill in that open gap, while continuing to respect the resistance of that 200-day moving average in red. This looks more like a consolidation. The Fed could push or pull this in either direction, but just looking at that consolidation and bullish looking flag on the chart, it may try to go higher.
The Federal Reserve will be giving us their decision on interest rates and the updated monetary policy statement at about 2 PM ET. There is a 99.9% probability of a rate cut today, and a 93% probability of a third cut in December.
S&P 500 has been down 4 of last 7 Fed FOMC rate decision days with an average loss of –0.48%, but it gained an average of +0.18% the day after, with 4 up, down 3. Not great numbers but over those last seven meetings, the Fed only cut the rate one time - in September. That day the S&P 500 was down, but it rallied for three days afterward.
We'll get the key inflation PCE Prices data data on Friday, and President Trump will be meeting with China's President Xi on Friday as well.
The DWCPF Index (S-Fund) pulled back sharply which contrasted with all the green in the big three major indices. But you can see here that it has just dipped back to test the breakout area. The bulls would love to see that red line hold, but filling the open gap and getting that out of the way would be fine as well - as long as the trading channel remains intact.
ACWX (I-fund) was up slightly and the chart is holding near those all time highs. There's still room above on the trading channel, but there is also a lot of room down to the bottom of the channel. There's an open gap near 66.50, and technically another one just below that, and filling one or both would be productive. Perhaps some volatility today will do the trick?
BND (bonds / F-fund) made another new high as yields continue to slide lower. It is possible that the Fed says something to send the direction of yields higher, which of course would push this chart down, but right now BND has a bullish chart trending higher, although there is some wiggle room on the downside in the short term.
Thanks so much for reading! We'll see you back here tomorrow.
Tom Crowley
Read more in today's TSP Talk Plus Report. We post more charts, indicators and analysis, plus discuss the allocations of the TSP and ETF Systems. For more information on how to gain access and a list of the benefits of being a subscriber, please go to: www.tsptalk.com/plus.php
Questions, comments, or issues with today's commentary? We can discuss it in the Forum.
Daily Market Commentary Archives
For more info our other premium services, please go here... www.tsptalk.com/premiums.php
To get weekly or daily notifications when we post new commentary, sign up HERE.
Posted daily at www.tsptalk.com/comments.php
The legal stuff: This information is for educational purposes only! This is not advice or a recommendation. We do not give investment advice. Do not act on this data. Do not buy, sell or trade the funds mentioned herein based on this information. We may trade these funds differently than discussed above. We use additional methods and strategies to determine fund positions.