- Reaction score
- 812
-
The Forum works well on MOBILE devices without an app: Just go to: https://forum.tsptalk.com
-
Please read our AutoTracker policy on the IFT deadline and remaining active. Thanks!
-
$ - Premium Service Content (Info) | AutoTracker Monthly Winners | Is Gmail et al, Blocking Our emails?
Find us on: Facebook & X | Posting Copyrighted Material
-
Join the TSP Talk AutoTracker: How to Get Started | Login | Main AutoTracker Page
You are using an out of date browser. It may not display this or other websites correctly.
You should upgrade or use an alternative browser.
You should upgrade or use an alternative browser.
Sensei's account talk
- Thread starter Sensei
- Start date
Sensei
TSP Pro
- Reaction score
- 27
Thanks! I'll add that to my favorites. I still like the WSJ though. Creature of habit.This site has loads of current info:
http://finviz.com/futures.ashx
Sensei
TSP Pro
- Reaction score
- 27
Re: Sensei's Account Talk
Here's a look at the SPX 2 year daily chart. When the last bull run started in 2010, it hit resistance at the previous high, and took about a month to consolidate before moving up again. Will we get to 1350? If so, expect a similar pattern?
[TABLE="width: 100%"]
[TR]
[TD]
[/TD]
[/TR]
[/TABLE]
Here's a look at the SPX 2 year daily chart. When the last bull run started in 2010, it hit resistance at the previous high, and took about a month to consolidate before moving up again. Will we get to 1350? If so, expect a similar pattern?
[TABLE="width: 100%"]
[TR]
[TD]

[/TD]
[/TR]
[/TABLE]
Sensei
TSP Pro
- Reaction score
- 27
Re: Sensei's Account Talk
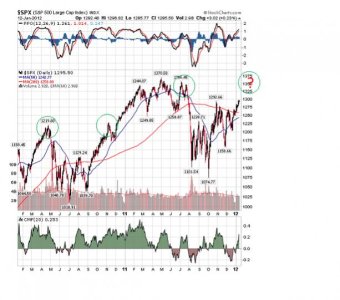
I've been trying my hand at playing with charts again. I found freestockcharts.com to be very difficult to figure out - I couldn't see how to add moving averages, and the timeframe skipped from a 1 year chart to a 5 year chart, without the capability of looking at the years between. So I went to just plain old stockcharts.com and found something I could copy and past into a word doc, then add shapes and stuff. Bquat, any tips for freestockcharts?
Anyway, back to my beloved WSJ charts, which I can't draw on. Here's the weekly, over a 2 year period. You can see the last bull run spanned the end of August 2010 to the beginning of February 2011. 20 weeks, 15 of which were positive. If the current uptrend is here to stay, it might be just beginning.
Bquat
TSP Talk Royalty
- Reaction score
- 704
Well you got me reviewing it also and I found so things. On top of the chart from left to right, the first square is the stock symbol you are charting. On the left side panel you can type in like SPX and it will give you some choices. The next square is indicator you select it and scroll down to moving average and select. Then you can click on the moving average and increase or decrease it to 20. Then add another indicator and edit it for 50 and select a new color. You can also edit the width of the line.Then do one for 200. Then the next box is the time frame and I use 30 min. that will expand and contract over about 40 days. Each tick mark on you chart will update in 30 min. Today I counted. The moving averages are for the number of periods in your time frame. So there is 14 time periods in a day on 30 min so the 20 period represents a little more that a day average, 50 is almost 4 days and the 200 is around two weeks. Now that I realized this I may change them for 5 day 50 day and 200 day buy multiplying by 14 and getting my count. I think they represent 1/2 the time in the 15 min and double the time in the hourly. Then you can add things from the left colomn like lines. If you use the fibinacci retracement start from the bottom of a dip to the peak. You can edit the color or remove them by selecting them on the graph and you can move or extend the lines by left clicking on the little circle on the end as you move the mouse over it. Ok 101 done and I hope this helps.
Sensei
TSP Pro
- Reaction score
- 27
Re: Sensei's Account Talk
A job posting over here caught my eye, so I logged in to USAJOBS for the first time in years to look into applying - all hypothetical of course. Wow! Supervisory positions are all raking in 6 figures these days. Something to think about down the line when my kids get a little older and more self-reliant.
A job posting over here caught my eye, so I logged in to USAJOBS for the first time in years to look into applying - all hypothetical of course. Wow! Supervisory positions are all raking in 6 figures these days. Something to think about down the line when my kids get a little older and more self-reliant.
Bquat
TSP Talk Royalty
- Reaction score
- 704
and?Thanks Bquat! I'll try it out this weekend.
Sensei
TSP Pro
- Reaction score
- 27
Despite the 3 day weekend, I haven't had a lot of time to play around, but I did figure out how to add moving averages. Thanks for your help there. Only problem is I wanted to look at a 2 year chart of the S&P to show what happened last bull market when the 50 SMA and 100 SMA crossed the 200. For some reason, the freestockcharts.com chart's 200 SMA wouldn't go all the way back to that point. It kind of randomly started in the middle of the chart. I don't know what was wrong, and haven't had time to play any further with it.and?
Anyway, what I noticed on the WSJ charts I look at is that when we last had a "golden cross" of the SMA, there was an almost immediate sharp rally that lasted about a week, but followed by a swoon of the same magnitude shortly after. Then the bull run resumed at a more moderate pace for the next few months. We look like we'll be getting the 50/200 cross of the SMAs in the next week or two. Just something to keep in mind.
Sensei
TSP Pro
- Reaction score
- 27
I'm interested to see how price reacted when the moving averages crossed one another in the previous bull market, which started the end of 2010. Here's a look:

Short Term
When the 50 crossed the 200, there was a big spike that was quickly sold off. I might look out for that type of action in the coming weeks. I'd like to hold in stocks until February, when I have my 2 IFTs back. If we get a golden cross and price is around 1350, I think I'll step to the side to wait for consolidation.
Longer Term
When the 100 crossed the 200, the market shot up, and continued up for the next 3 months, when it began to form a top. If you had exited when the 50 dropped below the 100 again, you would have averted the "crash" in July/August. I know history is not guaranteed to repeat itself, but the next time I see the 50 drop below the 100, that will be my cue to step aside.
Sensei
TSP Pro
- Reaction score
- 27
I don't expect many of you are baseball fans, but you're money fans - and this guy just guaranteed himself a lot of it. Yu Darvish - $60 million over the next 6 years to pitch for the Rangers. I got to see him here in Okinawa last year at the Fighters' spring training camp. Notice he's an entire head taller than the guy beside him (Yuki Saitoh - last year's first round draft pick in Japan), and notice he's throwing left handed. He's actually a right-hander, but this is part of his training I guess.
Wish he was going to my Dodgers instead. Oh yeah, I forgot - they're bankrupt!

Wish he was going to my Dodgers instead. Oh yeah, I forgot - they're bankrupt!

Sensei
TSP Pro
- Reaction score
- 27
Well, here's another go at Freestockcharts.com:
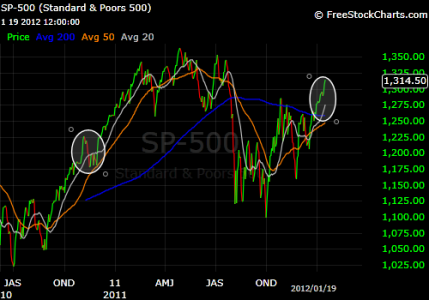
In the last bull market, the 20 day SMA proved to be pretty good support all along the way. Look what happened when the price got way above the 20 SMA, as it is getting now. Good sized pullback/correction. Actually crashed through the 20 and found support at the 50. So we could be looking at a pullback to 1275-1250. That's 3-5%. So how lucky do we feel?

BTW, what's up with the 200 SMA line (blue)? Why does it start in the middle of the chart like that? Anyone else using freestockcharts have this issue?
In the last bull market, the 20 day SMA proved to be pretty good support all along the way. Look what happened when the price got way above the 20 SMA, as it is getting now. Good sized pullback/correction. Actually crashed through the 20 and found support at the 50. So we could be looking at a pullback to 1275-1250. That's 3-5%. So how lucky do we feel?

BTW, what's up with the 200 SMA line (blue)? Why does it start in the middle of the chart like that? Anyone else using freestockcharts have this issue?
Last edited:
RealMoneyIssues
TSP Legend
- Reaction score
- 101
BTW, what's up with the 200 SMA line (blue)? Why does it start in the middle of the chart like that? Anyone else using freestockcharts have this issue?
My guess is that you are using a weekly chart and that goes back 200 weeks and that is the limit of their data. Can't make a 200 week average if you don't have the previous data... it's free
I opened a free papertrading account with ThinkOrSwim which allows me to paper-trade AND use their TOS platform. Data goes waaaaay back...
Sensei
TSP Pro
- Reaction score
- 27
Hmm, that does sound like a reasonable explanation, except the chart itself is a daily chart. When I go in to edit the indicators (the moving averages), it doesn't offer an option to select daily or weekly. I think if the chart is a daily, the MA is a daily. If the chart is a weekly, the MA is a weekly. You're right though - it is free, and you get what you pay for.:cheesy:My guess is that you are using a weekly chart and that goes back 200 weeks and that is the limit of their data. Can't make a 200 week average if you don't have the previous data... it's free
I opened a free papertrading account with ThinkOrSwim which allows me to paper-trade AND use their TOS platform. Data goes waaaaay back...
RealMoneyIssues
TSP Legend
- Reaction score
- 101
Hmm, that does sound like a reasonable explanation, except the chart itself is a daily chart. When I go in to edit the indicators (the moving averages), it doesn't offer an option to select daily or weekly. I think if the chart is a daily, the MA is a daily. If the chart is a weekly, the MA is a weekly. You're right though - it is free, and you get what you pay for.:cheesy:
Hmmm, I can't get into freestockcharts at work, but I can only assume it is because of the lack of data that far back to give an accurate trendline.
The indicators are based on the chart, if it's a daily chart, the 200 SMA is 200 days, hourly - hours, etc.
Bquat
TSP Talk Royalty
- Reaction score
- 704
Re: Sensei's Account Talk

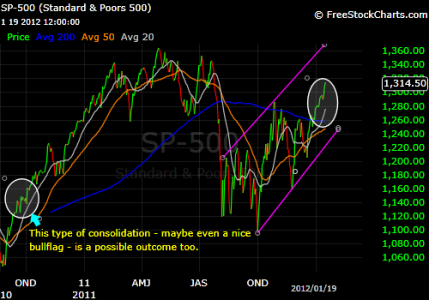
I also like you used the larger time frame and the circles to show a possible continuation of this bullish move. Yes you learn quick you learn well. Just remember there's a resistance line from the Head and right shoulder that needs to be broken.:worried: Might be a line to add but if we break it today it will be major support.
Looks to me your becoming a chart master.Allow me to paint a slightly more bullish picture:
View attachment 17154
Well, I'm getting the hang of using the charts now. If only I had some actual credentials to do technical analysis!:nuts:
I also like you used the larger time frame and the circles to show a possible continuation of this bullish move. Yes you learn quick you learn well. Just remember there's a resistance line from the Head and right shoulder that needs to be broken.:worried: Might be a line to add but if we break it today it will be major support.
Sensei
TSP Pro
- Reaction score
- 27
Re: Sensei's Account Talk
I should be calling you "sensei". You've helped me quite a bit - both with the charts, and with trying to understand this nonsense that I think will consume me for the next 30 years or so.
Thanks for showing the resistance lines. I think a few days of modest downward action will make a nice bull flag into that wedge between support below and overhead resistance. Then it could be lookout above.
Looks to me your becoming a chart master.
I also like you used the larger time frame and the circles to show a possible continuation of this bullish move. Yes you learn quick you learn well. Just remember there's a resistance line from the Head and right shoulder that needs to be broken.:worried: Might be a line to add but if we break it today it will be major support.

I should be calling you "sensei". You've helped me quite a bit - both with the charts, and with trying to understand this nonsense that I think will consume me for the next 30 years or so.
Thanks for showing the resistance lines. I think a few days of modest downward action will make a nice bull flag into that wedge between support below and overhead resistance. Then it could be lookout above.
Sensei
TSP Pro
- Reaction score
- 27
I suppose the most bullish thing I can point out about Friday's action is that it allowed the 20 SMA an opportunity to inch a little closer to price without sending the S&P into the red. Small gains or losses over the next few days will close that gap, bring us closer to support, and set up the next leg up. I hope. :embarrest:
Still 7 trading days left in this month, but really 8 for those who are out of IFTs, as you wouldn't be able to get back in until the second day of February. If I do decide to sell any portion of my stocks next week, it won't be 100%. I'm still considering maybe swapping some or all of my position in C for an increased position in S and I. Right now, I'm 50C/45S/5I. Thinking about something like 10C/80S/10I. Or maybe ditch C altogether and go 90S/10I. I don't trust the whole FV thing enough to put more than 10% in I though.:notrust:
Still 7 trading days left in this month, but really 8 for those who are out of IFTs, as you wouldn't be able to get back in until the second day of February. If I do decide to sell any portion of my stocks next week, it won't be 100%. I'm still considering maybe swapping some or all of my position in C for an increased position in S and I. Right now, I'm 50C/45S/5I. Thinking about something like 10C/80S/10I. Or maybe ditch C altogether and go 90S/10I. I don't trust the whole FV thing enough to put more than 10% in I though.:notrust:
Similar threads
- Replies
- 0
- Views
- 153
- Replies
- 7
- Views
- 975
- Replies
- 0
- Views
- 65
- Replies
- 0
- Views
- 193

