Nordic's Account Talk

SPX treading water

Hard to believe with the recent volatility, but we're essentially at the same level on the SPX as we were in mid-February. We'll have to break out of this sideways channel eventually. August can be a volatile month, so hang onto yer hats and do your reading.
 
Re: SPX treading water

Hard to believe with the recent volatility, but we're essentially at the same level on the SPX as we were in mid-February. We'll break out of this sideways channel eventually. August can be a volatile month, so hang onto yer hats and do your reading.

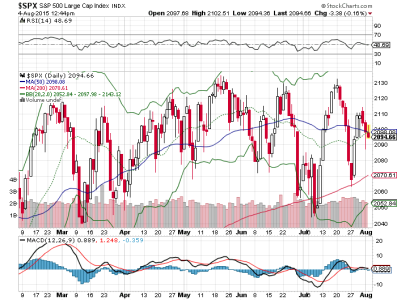
If you come across some good stuff, please don't be shy. Looks like a rounded top to me, but I know nothing. We are still in a bull market so this thing should break to the upside.
 
update

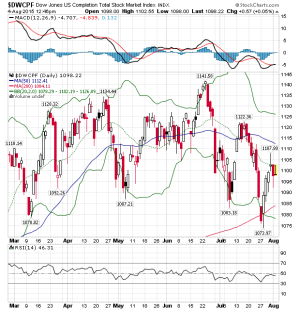
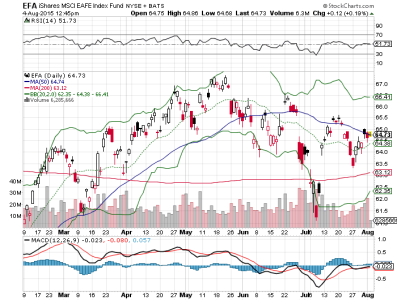
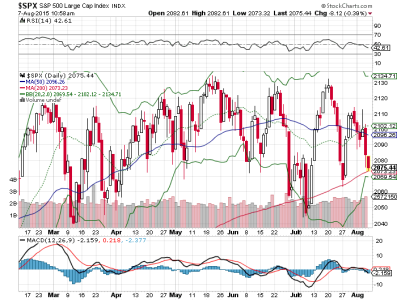
Here are today's charts, which show the indices mostly treading water today...MACD (except for DWCPF, which is oversold), RSIs, and BBs are at neutral positions in the equity funds. I do find the spread in the Bollinger Bands to be interesting, but not quite sure what to make of it technically. The dollar is also showing little movement today and is hovering around 97. All three are showing rounded top patterns and possible bear flag formations, so those are concerns also. Until I see a shift in direction, I'm content to sit in the G Fund, especially considering seasonality. Greece, Puerto Rico, China, and oil continue to make headlines, so I still think caution is warranted here.

spx.png
dwcpf.png
efa.png
 
direction

"There is no ‘doubt’ the internal are continuing to weaken.

So where are we? It’s starting to feel like this is the beginning of the end to the bull cycle, and today, all eyes will be on the July jobs report. This does not mean I think we are going to crash, nor does it mean we will not go back up, but the warning lights are flashing, and August into the middle of October could spell danger for the S&P and the global markets."

S&P 500 Futures; Reasons To Be Concerned - Yahoo Finance


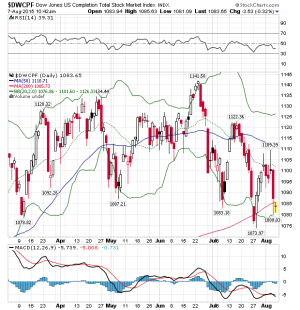
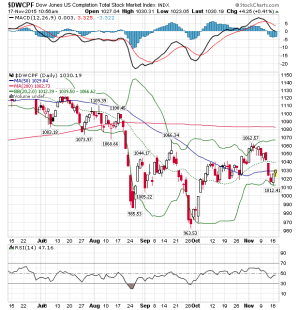
Is this a "wall of worry" or the real deal? Great question that I obviously don't know the answer to, but with our limited IFTs and bearish seasonality, I'm going to wait a bit longer before jumping back into equities. The DWCPF (S Fund) appears to be closer to a buy than the SPX (C Fund) or EFA (I Fund) judging from it's proximity to its lower Bollinger Band, but both the RSI and MACD histogram indicate that there could be room to fall further. Also concerning is that DWCPF just crossed below its 200 DMA. I wouldn't be surprised to see a bounce here, the question is how much of a bounce would it be and would it soon head back down to lower levels with three weeks to go in August? Tough call but I'm going to sit on my lilypad for the time being. Good luck


spx.png
dwcpf.png
 
What's your take on today's action?

Last week I said "I wouldn't be surprised to see a bounce here, the question is how much of a bounce would it be and would it soon head back down to lower levels with three weeks to go in August?", so I think today's bounce falls in line with that thought. Now the question is how much of a bounce do we get here and will it shortly reverse back down to continue the rounding pattern that is developing? My inclination is to watch this bounce play out and see what happens...possibly look for a better entry point later in the month, assuming we get one. You know how these summer months can play out. The only thing I do know is that my confidence isn't as high as it was in June or July, that we'll get a reliable bounce off the lower BBs that's worth burning an IFT for. Lot of time left in the month. What's your assessment jpcavin?
 
Re: Greece

I'm not qualified to give an assessment, that is why I value yours as well as that of a few other members on this board. Whatever opinion I have, the opposite always seems to come to pass. My latest bright idea was jumping in around Thursday just because the Traders almanac said the first 9 days of August are historically volatile. I was talked into going in on Friday against my better judgment and it worked out ok. Waiting to see what happens between now and Thursday. Every time I think I've learned something, the only lesson I end up learning time and time again is that it's all a crap shoot. Sometimes I get lucky.
 
IFT

MACDS and BBs are at low enough levels for me to pull the trigger here, although the RSIs could be lower. I'm diversifying among C, S, and I but more heavily with C. Confidence? Honestly not the greatest right now with what we've seen so far this month, bigger picture the equity funds are presently rounding down. Just looking to catch a decent bounce at these levels, and will be ready to exit or maybe try the F fund on any given day. Best of luck to you.
 
Re: IFT

MACDS and BBs are at low enough levels for me to pull the trigger here, although the RSIs could be lower. I'm diversifying among C, S, and I but more heavily with C. Confidence? Honestly not the greatest right now with what we've seen so far this month, bigger picture the equity funds are presently rounding down. Just looking to catch a decent bounce at these levels, and will be ready to exit or maybe try the F fund on any given day. Best of luck to you.

I'm in today too. More on I & S less on C G 65% emergency aw crap fund. :-) Thinking China crap may affect C fund and keep it a bit weak. See how it goes before I add anything else back in. No guts to go in 100%.

Best of luck.
 
Re: IFT

MACDS and BBs are at low enough levels for me to pull the trigger here, although the RSIs could be lower. I'm diversifying among C, S, and I but more heavily with C. Confidence? Honestly not the greatest right now with what we've seen so far this month, bigger picture the equity funds are presently rounding down. Just looking to catch a decent bounce at these levels, and will be ready to exit or maybe try the F fund on any given day. Best of luck to you.

Agree. Makes me feel better about going in today also.
Good luck....you've had a great year, one of the best...now you are going in for the kill on the Tracker, ehh? :)

p.s.
Don't forget to update your signature. I sometimes do that when I make an IFT but leave my old allocation.:smile:
 
Re: IFT

Agree. Makes me feel better about going in today also.
Good luck....you've had a great year, one of the best...now you are going in for the kill on the Tracker, ehh? :)

p.s.
Don't forget to update your signature. I sometimes do that when I make an IFT but leave my old allocation.:smile:

Thanks FWM, yeah I made my IFT using my phone but couldn't figure out how to change my signature on the phone...the page is not set up the same as when I see it on a desktop/laptop, need to figure that out. As for the markets, you know how humbling they can be. I'm just trying to be more patient and maybe less greedy with the timing of my moves...but who knows how long the good luck will last, especially the next few months. If I can cherry pick the easiest 1-2% each month, that's a pretty decent yearly return...easier said than done. Hopefully our move today pans out.
 
All aboard the pain train

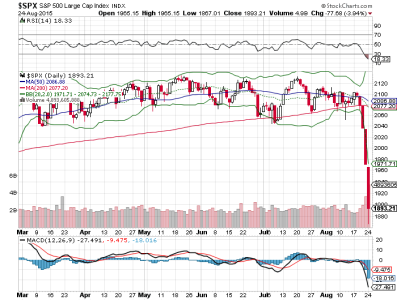
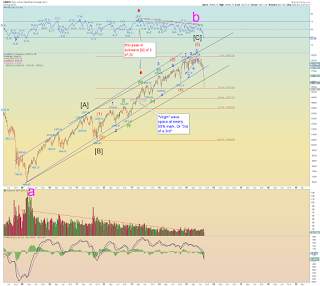
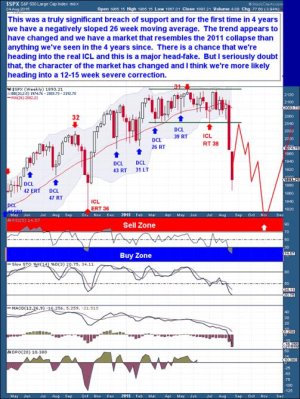
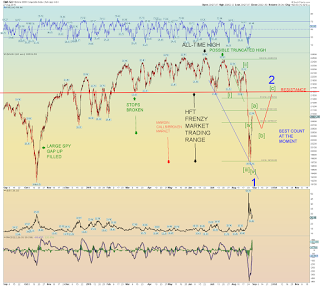
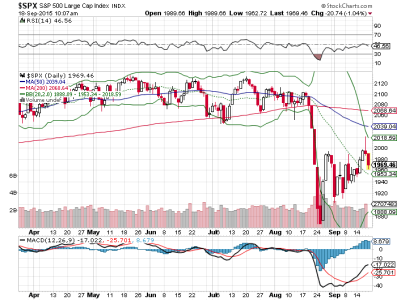
Well, that pretty much sucked. I've been leery of the equity markets for the past few months, but I sure wasn't expecting that kind of waterfall drop...kudos to those who managed to avoid it. At this point I'm going to try and recover as much of this loss as I can before exiting equities. Obviously we are short term oversold, but the big question is how much of a possible bounce will we get, and will the market continue it's decline after the bounce. I suspect that it will continue to decline, as the rounding top pattern seems to have come to fruition the past few days. Elliot Wave Theory has been predicting this decline, albeit not this swiftly necessarily, with the Ending Diagonal Pattern that has been forming for months now.

Hang in there folks, it's been a tough past few days for those who were invested in equities. Bull markets do end eventually and it's important to recognize when the end has begun in order to consider a strategy shift with capital preservation in mind.


sc.png


Daneric's Elliott Waves

DJIA weekly.png

Sound the Alarm | Bob Loukas | Safehaven.com

38706_i.jpg
 
out

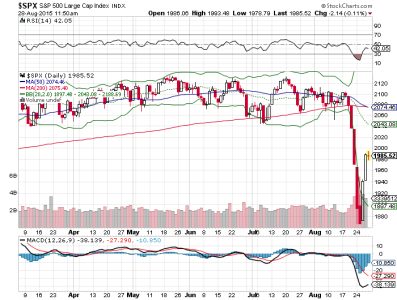
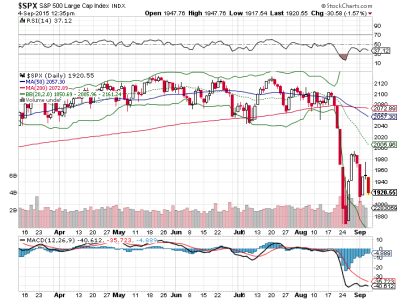
I managed to recover roughly half of the loss I took since re-entering the equity funds on 8/13, but will still take a loss for the month after exiting to G Fund COB today. After some reflection I've come to the conclusion that greed got the better of me as I had a growing feeling that things would possibly go "gunny sack", based on what I was seeing in the charts. The "buy the bounce off the lower Bollinger Band" play finally failed me this last time and I got bit pretty good. I think that strategy works pretty well during bull markets, but not necessarily as predictable during bear markets....or the occasional waterfall cascade down that we just experienced. The charts are still looking bearish in the intermediate term with the rounded top continuing to form and solidify, and timing the bounces is more hazardous in the current environment. I'll be curious to see how September plays out with it's bearish seasonality and possible Fed rate hike around the corner. Good luck and safe trading.

spx.png


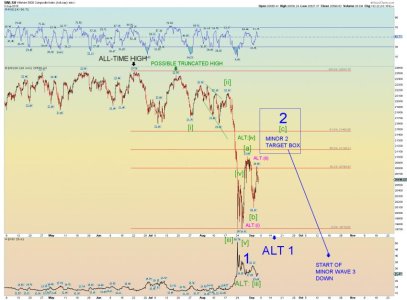
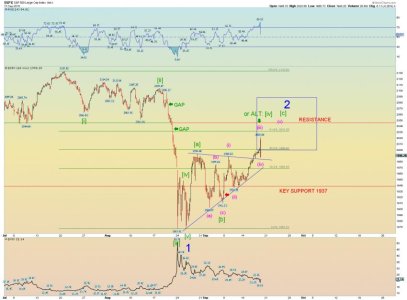
"My guess is that we are probably in a wave 2 up instead of a wave [iv] of 1 down. Regardless, the market is at the mercy of the HFT's. Underlying liquidity is quite suspect."
Daneric's Elliott Waves

WLSH1HOUR.png
 
not yet

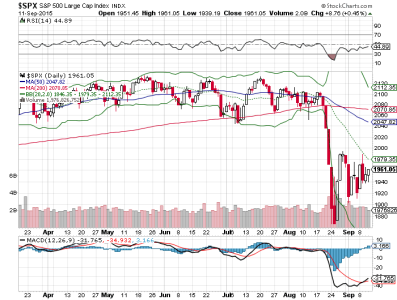
More selling today, and we're really only in moderately oversold territory with room to the downside. Unless there's another bout of serious selling like we saw a couple of weeks ago, I probably won't be tempted to jump back into equities until after the upcoming Fed announcement, just too much risk out there and staring a bear market in the face with many negative divergences and death-crosses in equities. Have a good holiday weekend.

sc.png

Daneric's Elliott Waves
wlshhourly.jpg
 
Waiting on the Fed

"When all time frames combine for negative divergences at new highs it's pretty much the kiss of death for equities. The biggest headache being the size of those nasty divergences that would form. Just huge. So while it's possible if not likely we'll make many tests up over time the bull market is likely on its very last leg. We can hope to see 2200 or so and that's definitely no guarantee, but much beyond that will be difficult and once those divergences kick in that would probably be the end of the bull market. It's my belief that most of the good times from this long running bull are over."

Waiting On The Fed...What The Market Likely Wants....Weeklies Unwind...Big Picture Outlook... | Jack Steiman & Robert New | Safehaven.com


One of many bearish articles floating around out there. If this is indeed the case, which a growing amount evidence is suggesting that it is, then short term exposure to equities and careful IFT timing will be key to making a positive return. A bounce even up to 2100 from these levels is nothing to sneeze at, but let's see how this week plays out first.

sc.png
 
now that the Fed has spoken...

"The top chart reflects that the S&P looks to have created a reversal pattern (bearish wick) yesterday at dual resistance."

Kimble Charting


Let the bearishness continue. The indices had reached their Upper Bollinger Bands recently, which are constricting again by the way, so it's not surprising to see today's decline, the question is how far will it go? Many charts are indicating that we have been in the midst of a Wave 2 retracement of the Wave 1 waterfall decline we experienced in August, and now that Wave 2 is at/near completion...well, no bueno! Wave 3s down are normally the most severe, so caution is definitely warranted here. Now that the Fed has spoken and left rates alone for the time being, I'll be very interested to see how the markets react during the next couple of months. Perhaps it will be a sign that the economy isn't as strong as we thought if the Fed is hesitant to begin even modest rate hikes...perhaps the markets won't like that very much. Very risky environment we are currently in, trade carefully.

sc.png

Daneric's Elliott Waves

spx1hour.jpg
 
fair warning

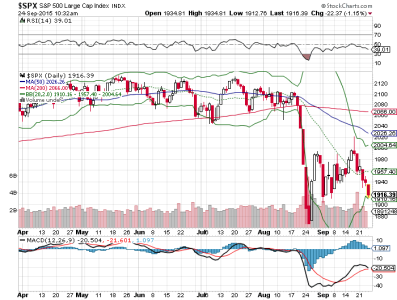
I pose a question, if I had received advanced warning of the waterfall decline we saw at the end of August, would I have exited equities? Answer: You betcha, bub. How do we know when things are about to tank? I'm not sure, with much confidence, that there is a fool-proof guaranteed way to know for certain when equities are about to fall hard, but it seems to me that technical analysis is our best bet at receiving fair warning that a substantial decline is about to take place. In other words, it's all about playing the odds...and TA may, but not absolutely, put the odds in our favor of avoiding the larger declines. There are no guarantees in the market game, but I personally am willing to play the odds based on TA. Based on the charts and some basic TA, it appears to me that we still have room to fall before we experience the next meaningful bounce in equities. I of course could be wrong, but I'm just playing the odds here. By the way, kudos to those on the AutoTracker who have managed a 2%+ return this month, very nice work.


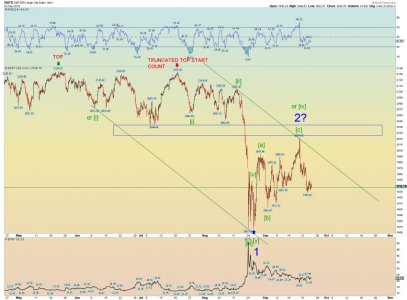
We're hitting the lower BB, but the MACD is rolling over again and has plenty of room to fall potentially. As we saw in August, hitting the lower BB in a bear market does not automatically mean we'll bounce off that lower BB...we could just continue to ride the BB to even lower levels. Dangerous and difficult times in equities, timing the markets is really tough right now. Play the odds carefully here.


sc.png


"Global head of technical analysis at Credit Suisse, David Sneddon said breaking through the 2,040 level on the S&P 500 was a bearish indicator, with 1,900 now the next key level to watch, with stocks under pressure to test the lows seen last month."

http://www.cnbc.com/2015/09/24/char...adline|headline|story&par=yahoo&doc=103023347

Daneric's Elliott Waves

spx1hour.jpg
 
back in

Jumping back into equities, 50 C / 50 S COB today. I've been largely disengaged from the markets since the end of September and as a result I missed the entire rocket ship ride we experienced in October. I have to admit that my confidence and comfort is not great right now. I still think we are due for a much larger drop than what we saw at the end of August, and as a result I'm in ultra-conservative mode. Will we see a Santa rally this year with a rate hike staring us in the face? Looking at the larger time scale charts, we are still very near all-time highs which feels/looks more like sell territory than buy territory. Staying on my toes and ready to jump back into G fund when necessary. Good luck.

sc.png
 
Re-balancing to S Fund

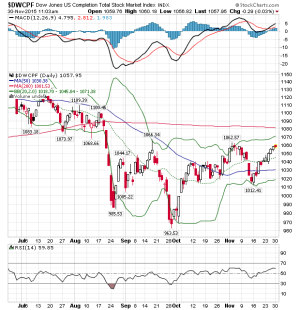
Making an IFT COB today to 100% S Fund from a mixed allocation based on the S Fund's recent performance. I'm not sure how long I'll stay invested as we typically see some mid-December weakness before a Santa rally, assuming we get a Santa rally again this year. Depending on what happens, I'll consider jumping to safety in the G fund either late this week or early next week. The DWCPF chart (S Fund) is indicating we could still move a bit higher before we see a pullback away from the upper BB. The Fed FOMC meeting is scheduled to take place Dec. 15-16, which may be a good time to get back into equities for the Santa rally. With a likely interest rate hike announcement at the Fed meeting, I'll be curious to see how much of the rate hike has already been priced into this market. Best of luck.

sc.png
 
what now?

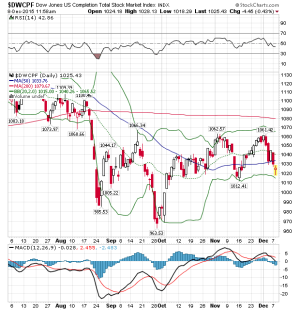
Crappy way to start the month, but based on the DWCPF chart basically at the lower BB, maybe we're ready for a bounce soon. I don't know what to think of next week's Fed meeting, it seems like it could go either way in terms of price action, so I'm thinking of possibly staying invested through next week...I'm not sure yet. We haven't seen an interest rate hike in many years, so I don't know how the market is going to react next week...perhaps it's already priced in, perhaps not. Feels like a coin flip. Bigger picture it still looks like a rounded top pattern forming in the equity charts, so we'll have to keep an eye on that. C'mon Santa, what's your ETA?

sc.png


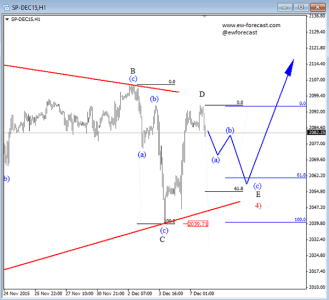
Elliott Wave Analysis On SP500 And USDJPY | Gregor Horvat | Safehaven.com

39784_a.png
 
Back
Top