Nordic's Account Talk

Weakness in week two

"However, this is not meant to instill fear. A buying opportunity could soon follow. Those who purchased the S&P 500 since 1990 on the close of the second week have been rewarded. Average returns from the second week through end of year have been a healthy 1.75% with a 75% win rate. Furthermore, it has been higher six out of the past six years with average returns of 3.03%."

Weakness in Week Two | Tumblr Blog - Yahoo Finance


I don't enjoy taking it in the shorts with the F fund this week, but I'll be looking at finally buying back into equities later next week for the rest of the month. I said this about 2014, but 2015 should be interesting in terms of volatility. Happy transferring.
 
jumping in

IFT into the S Fund for the rest of the month on today's weakness. There could be more downside before a Santa rally begins, but I think we're close enough. I'm expecting that one of these years Santa will leave us with nothing but coal in our stockings, but hopefully this is not that year. Good luck.
 
what's next?

Ahh, the excitement is back. So many variables at play...dollar, oil, Europe. We are STILL near all time highs and volatility continues to trickle up, what does that mean going forward? I know the trend is supposed to be our friend, but the recent up and downs has me on my toes. I parked in the F fund today, waiting to see if we can get a better sense of direction....right now I don't have a clue where we might head next. Good luck compadres.

This is setting up for a rally, expert says#.
 
Re: strength of the dollar

Back into the C and S funds I go COB today. Still on my toes, many moving parts abroad that could impact the markets.
 
Re: strength of the dollar

Kind of did the same thing. I was equal weight C, S and I but punted back to 25% C 25% S and 10% S for a little more safety since I am going on vacation tomorrow. I do think that things like Greece, Ukraine and Asia will work out though, at least for this month. Good Luck.
 
March

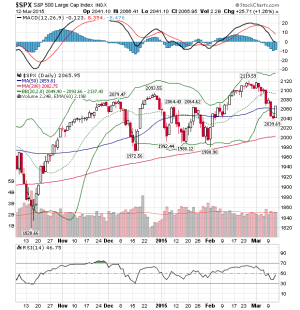
February gave us some sweet gains, so how will March turn out? I normally try to go into a new month invested in equities if at all possible, but I will begin March on the sidelines...just not sure for how long. There appears to be some topping action on the SPX charts.
 
bearish crossover on MACD

There's a bearish crossover on the SPX MACD today, which has been declining for at least the past week....basically a warning sign of a pullback. Just don't know how far it will go.
 
caution

"Technically, however, something exciting is about to start as the Dow and other major averages fall below their parabolic stop-and-reverse levels — a precondition for a period of weakness.
This is a big deal since stocks have melted higher over the last few weeks into a severe overbought condition — ignoring the weakening of fundamental earnings and economic data — powered by a surge of bullishness among “dumb money” traders to a level, by one measure, not seen in more than a decade, according to SentimenTrader."

Are Stocks About to Slip Into Weakness?


Let's get a healthy pullback started and over with as part of the normal cycle of things so we can jump back into equities. We are/were at record level highs, so a pullback is overdue...3-4% will do nicely.
 
are we there yet?

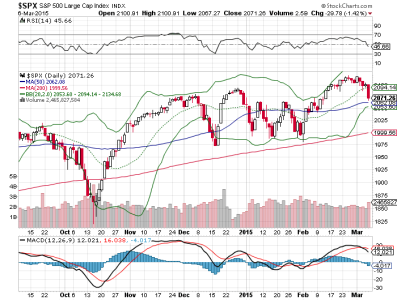
I'll be curious to see where the SPX decides to bounce from off this latest pullback. Recent activity indicates that the 50 day moving average has been surpassed, and instead the lower Bollinger Band has acted as support before a rally kicks in. This time however, the lower BB is located right next to the 50 DMA, so this time might be different. It's a tough call at this point, the lower BB in mid-December followed the SPX down a few % before we the Santa rally initiated. We're closer to working off the overbought conditions, but the MACD also indicates that we may have more work to do before buying into equities.

spx.png
 
what to expect this coming week

"The SPY started the week to the upside, testing the 212 area and in consolidation. But it did not take long for the price to break to the downside. The 20 day SMA acted as support for a couple of days but then Friday saw a big push lower. The range of the long red candle had not been seen for two weeks. It ended the week below the December high but over the January high of the prior consolidation range. The daily chart shows the RSI pulling back along with the price pullback from the rising trend resistance and the MACD crossed down and falling. These all bode for more downside.

On the weekly chart the price moved back into the consolidation zone that started in October. The RSI on this timeframe is falling but bullish and the MACD about to cross down. Also a downside bias. Notice on both timeframes that the Bollinger Bands® are tightening, often a precursor to a bigger move. There is support lower at 206.40 and 204.30 followed by 203 and 202.30 before 200 and 198.60. Resistance higher stands at 209 and 210.25 followed by 212.25. Continued Pullback in the Uptrend."

Dragonfly Capital Tumblr


Not a surprise, but I'll also be looking for an entry point in the next couple of weeks if we continue to get a meaningful pullback. Let's see how this plays out...
 
Re: what to expect this coming week

"The SPY started the week to the upside, testing the 212 area and in consolidation. But it did not take long for the price to break to the downside. The 20 day SMA acted as support for a couple of days but then Friday saw a big push lower. The range of the long red candle had not been seen for two weeks. It ended the week below the December high but over the January high of the prior consolidation range. The daily chart shows the RSI pulling back along with the price pullback from the rising trend resistance and the MACD crossed down and falling. These all bode for more downside.

On the weekly chart the price moved back into the consolidation zone that started in October. The RSI on this timeframe is falling but bullish and the MACD about to cross down. Also a downside bias. Notice on both timeframes that the Bollinger Bands® are tightening, often a precursor to a bigger move. There is support lower at 206.40 and 204.30 followed by 203 and 202.30 before 200 and 198.60. Resistance higher stands at 209 and 210.25 followed by 212.25. Continued Pullback in the Uptrend."

Dragonfly Capital Tumblr


Not a surprise, but I'll also be looking for an entry point in the next couple of weeks if we continue to get a meaningful pullback. Let's see how this plays out...

Amen!

Frank
 
relentless dollar

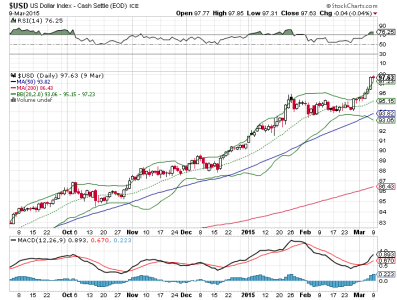
With the dollar going Apollo on us, I was curious what the charts were saying about it....specifically the MACD and BBs. Appears to be in overbought territory, even the RSI is over 76 now. Still, I don't know if I could pull the trigger on the I fund right now even with the charts flashing buy....but it is tempting. I think our other two equity funds have a bit more to fall, but they are doing a good job of working off the overbought conditions. Soon, but not yet...not yet.


$USD.png
 
Re: relentless dollar

Good observations. I Fund is getting smashed today. The dollar strength has been relentless, especially since the economies of Europe and China are slowing so much. The Euro is in serious trouble. Billions of Euro's are flooding the system, trying to pump up the banks and financial system to keep it from collapse.

From what I'm seeing in the charts, the $USD has gotten overbought on the RSI over and over, but then consolidates before it heads higher again. There hasn't been a meaningful pullback in a long time, and I don't foresee a pullback anytime soon. The I Fund will be a tricky play, because of this strength, IMHO.
 
pulling the trigger

I wouldn't be surprised if this pullback continued for a bit more, but we may be close enough to take a chance at re-entering equities at this point. S fund is out-performing C fund recently, so I'll IFT 100% S fund COB today. Good luck

sc2.png
 

Attachments

  • sc.png
    sc.png
    25.1 KB · Views: 260
charts

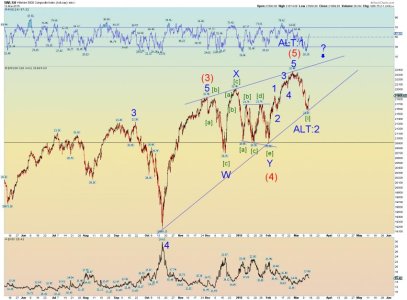
While I still believe we are overdue for a more substantial pullback/correction, I'll take these gains while I can get 'em. Question is, if we don't reverse here how far can this next leg up go? Charts are indicating a few percent possibly...if only it were that easy, eh? I'll be very interested to see how the Fed plays its cards over the next couple of months.

sc3.pngwlshhourly.jpg
 
what now?

"Conclusion:
Everything that matters turned upward last week. This rally should be good for 2 months.
I expect the major averages to be higher on Friday March 27 than they were on Friday March 20."

Technical Market Report for March 21, 2015 | Mike Burk | Safehaven.com

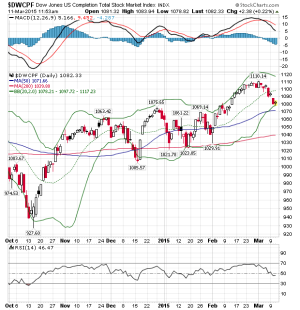
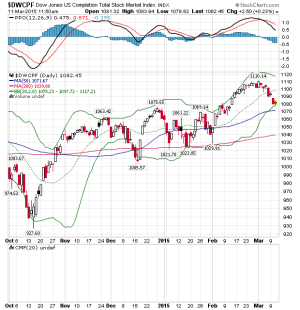
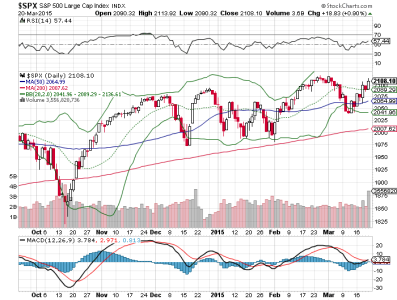
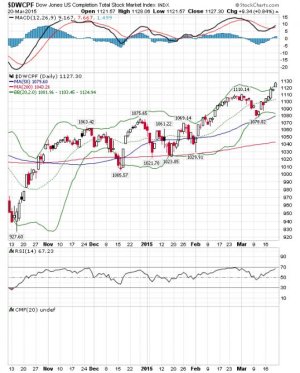
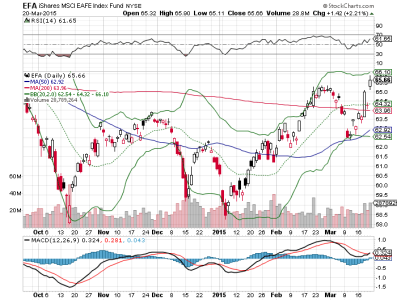
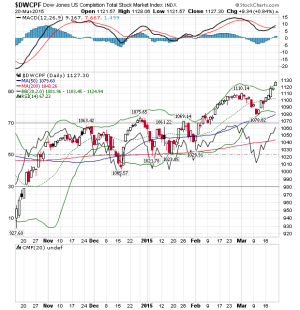
Really? I hope that's not complacency I'm reading. I'm willing to let things ride in equities...for now. We're approaching short-term overbought conditions, the dilemma being is it worth it to try and time the normal minor waves down if the overall trend is up? I get lucky occasionally trying to time the smaller pullbacks, but I find that just as often I get burned/whipsawed trying to do too much timing with our limited IFTs. Chartology indicates we're looking pretty damn good on the SPX (C Fund) and EFA (I fund) charts, whereas the DWCPF (S Fund) is approaching more of a possible overbought condition. To the charts:

spx.png
dwcpf.jpg
EFA.png
 

Attachments

  • dwcpf.png
    dwcpf.png
    27.3 KB · Views: 247
Back
Top