Nordic's Account Talk

short-term entry

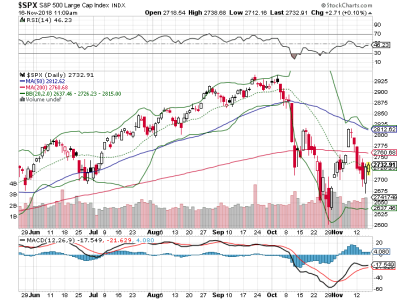
The SPX got down to 2628 before bouncing up from that level this morning, my thought is this might be close enough to the 2625-2600 level for a short-term play here. Don't know how long I'll stay in, possibly just a day or two depending on the rebound. 100 C Fund COB.

untitled.png
 
entry

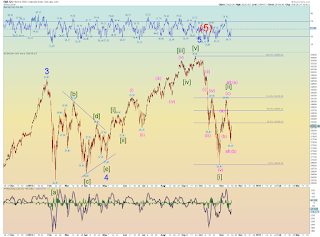
Well, I botched my last exit the end of October and pulled out way too early after actually timing my entry nicely...I won't be quitting my day job anytime soon :smile: . I'm still bearish in the intermediate term, but am still trying to pick up gains when the charts show decent entry points...which the current inverse H&S pattern looks to be indicating. While the SPX is still below it's 200 DMA, there appears to be a possible wave C (of 2) in progress, so we'll see. Also hoping for some holiday upside next week. Still a ton of geopolitical crap out there, which can move the markets just as much as the fundamentals and data. Best of luck in the coming week. 100 C Fund IFT today.

S&P 500 chart:

untitled.png

Elliot Wave counts:

Wilshire 60.png
 
December

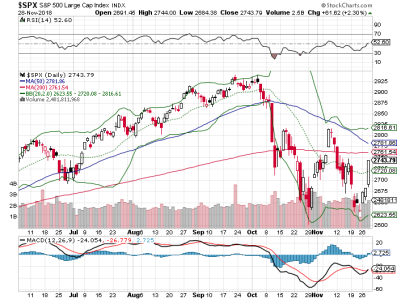
Nice gains in the equity markets today, with many chart technicians calling for a better looking December than a couple of weeks ago. I've been reading articles and watching some videos this evening trying to get a handle on what some folks think might happen in December...and there seems to be at least some agreement that we are in the beginning stages of the next up wave, before the next big downward push possibly in January-ish. Right now I'm inclined to stay in equities and see if I can finish this year on a high note. I have to admit it's been a frustrating year, but we all know those happen occasionally...some more than others :smile:. It's sounding more likely that the Fed will employ another rate hike at their December meeting before halting for a bit and seeing what the landscape looks like early next year. Not sure if the rate hike week will be the catalyst for a wave down, but I wouldn't be surprised. 2019 is shaping up to be a very challenging year in the markets, but let's see how December finishes out first. Letting it ride 100 C fund for now.

sc.png
 
beware the bear trap

Currently we appear to be in the last leg up (c, of an a-b-c) of Wave 2 (Wave 1 being the October lows), before the next major downward move Wave 3 begins...sometime early next year possibly. Caution and patience are critical now.

"Bears expected the S&P 500 to break below 2,600 last week, but instead the market headed up on Monday, Henrich noted. Powell did his part to help the rally, and if Trump gets a deal with China, that would complete that bear trap, pushing gains possibly into the first quarter of next year," he said"

https://www.marketwatch.com/story/h...vestors-into-a-dangerous-bear-trap-2018-11-29
 
back to the 'pad

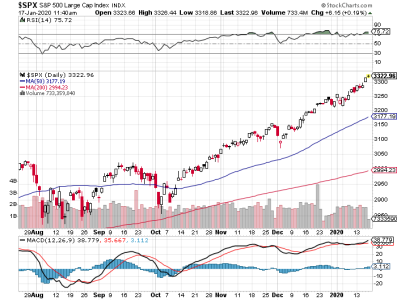
I haven't posted in forever, just a quick update. I began the year in the C Fund (chart below), but the charts are indicating an overbought condition, of course I've been saying that for most of the past couple of years and it's cost me many gains :suspicious:. Equities have advanced uninterrupted for the past four months, just weighing the odds at this point. Best of luck!

sc.png
 
charts

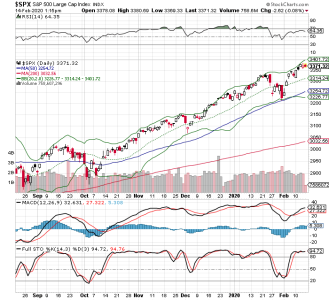
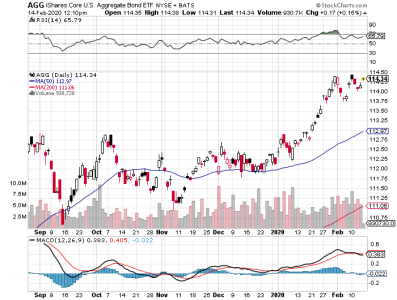
It's been a nice run so far this month in equities, and it's possible it may continue...but at this point that charts are looking a bit short term toppy. I thought the F Fund chart looked interesting with what appears to be a well defined cup and handle pattern, which often is a bullish continuation pattern. With coronavirus continuing to be a factor, and the charts where they are I made an IFT COB today to the F Fund. Not sure for how long, we'll see what happens next week.

S&P 500 (C Fund) chart:
sc (1).png


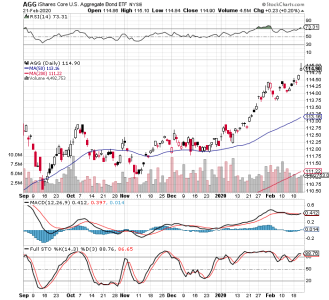
AGG (F Fund) chart:
sc.png
 
negative divergence and bearish cross

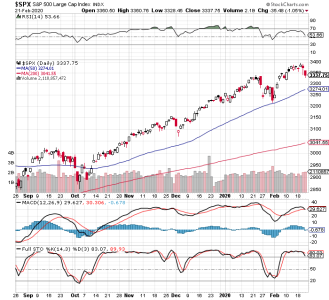
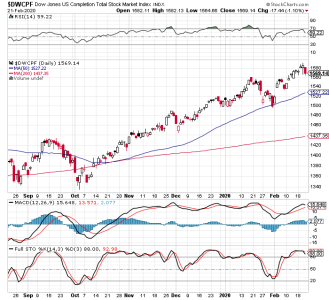
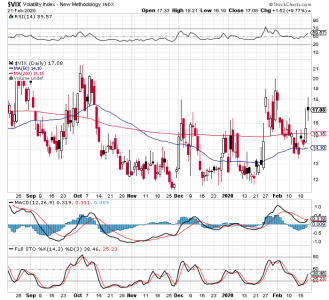
Things are getting interesting in the markets. Looking at the charts, we can see a number of negative divergences in equities as well as bearish crosses. This past week might turn out to be an important one to look back on for market analysis, time will tell. The AGG (F Fund) is still looking solid, while the VIX is on the rise which is bearish for equities. I plan on staying in the F Fund for a while longer. Best of luck next week.

SPX (C Fund)
sc.png

DWCPF (S Fund)
sc (1).png

AGG (F Fund)
sc (2).png

VIX
sc (3).png

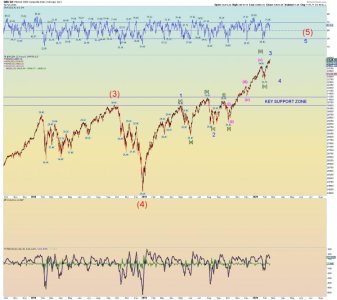
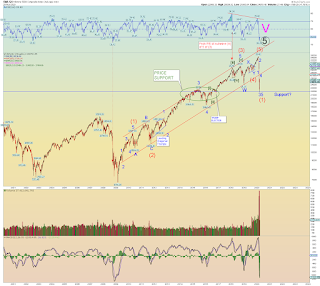
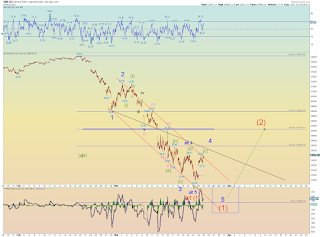
Looking at Daneric's chart, we're getting close if not already started down on wave 4 of (5).
WLSH2.jpg
 
Re: negative divergence and bearish cross

We'll just keep each other company in (F). :beerchug:
 
Looking for a short- term oversold wave B bounce at these levels. Might only be for a day or two as I think there's more room to the downside before we find a bottom. IFT 100 S Fund COB today.
 
Looking for a short- term oversold wave B bounce at these levels. Might only be for a day or two as I think there's more room to the downside before we find a bottom. IFT 100 S Fund COB today.

If I had another IFT I would have done the same and been right there with you. Good luck! I decided that the F fund is running on fumes now and bailed to G instead today.
I did the same for my wife's TSP and moved from F to G (she's now at +7.21% for the year since I was more patient with one of the moves in January in her account).
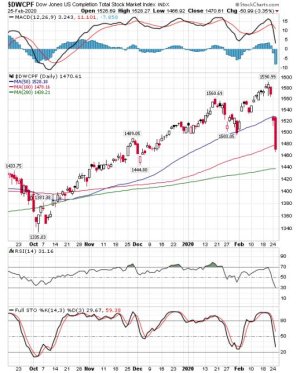

Agreed, the F fund appears to be getting stretched, at least on the charts. My move was more on a gut feeling than anything on the charts, we've seen these corrections play out where it drops, hits a key support level (possibly 100 or 200 DMA?), and then bounces...before resuming down in a wave C move. I don't plan on staying long, before a likely move to the G fund possibly before Friday and my last IFT for Feb. This sucker could also sink another 2-3% before a wave B bounce, we'll see. Best of luck.

sc.jpg
 
updated wave count

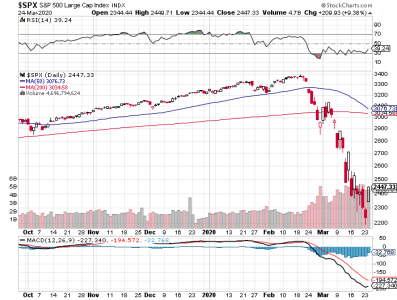
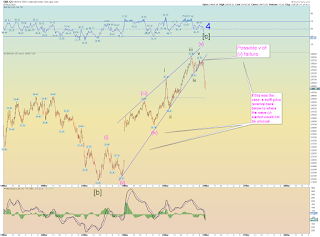
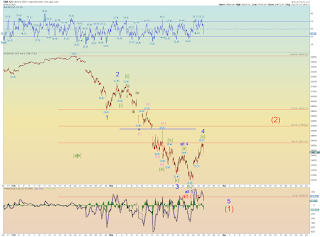
A lot has changed since my last post a month ago, and I have a pretty good ass whuppin' to show for it. The lack of any follow through on the few bounces we've seen has made it difficult, with the 2-3 monthly IFTs we have, to make an easy exit. Daneric's longer term wave analysis was indicating this current Bear market was approaching, but the Covid-19 crisis seemed to expedite the arrival of this massive decline. What's concerning to me, is that we could only be nearing the end of wave (1) of 5 DOWN! At this point I don't see how we revisit the highs of a month ago, now that we are in a bear market. It's not clear if today was wave 4 (of 1) up, or possibly the beginning of wave (2) up...either way, difficult decisions lie ahead to start chipping away at the losses from this brutal month. Covid-19 is wreaking havoc, and this country is still in the early stages of it.

For the first time in my federal career, I have to admit I'm starting to consider other investment options outside of TSP, primarily because of the relative lack of flexibility for moving funds around. I have a lot of homework to do on what's available.

Updated wave count:

WLSH 10 MINUTE.png

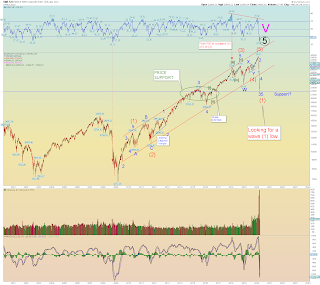
Big picture:

WLSHWeekly.png

S&P 500 chart:

sc.png
 
Re: updated wave count

Same here. Maybe it's hindsight, but these wild moves, with little flexibility has me reconsidering staying in the TSP once I retire.
 
Re: updated wave count

I have an account with Vanguard; its member owned so very little in the way of commissions and fees to pay. With electronic delivery of prospectus and other docs, its pretty much free. Had if for a month or so, still trying to figure some of it out. I've bought a few funds... working on stocks.
Good to know. Did you put any of your TSP funds into your Vanguard account?
 
Re: updated wave count

No, put in funds I pulled from another investment company that was taking 1% of my balance, regardless of what it earned, which really annoyed me.
 
now it gets interesting

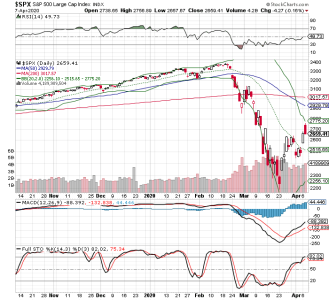
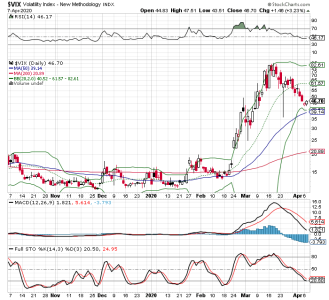
Looking at the charts, it appears we are nearing (or possibly reached today) the end of retracement Wave 2, which reached the bottom of the previous bull market trend line. I was very tempted to jump into equities last Friday to catch the end of Wave 2, but with only two IFTs and being very early in the month, I decided to hold off until Wave 2 concluded and Wave 3 unfolded...which could be a wild ride if history is any indication. A number of analysts are following similar wave counts and a deeper downward move (Wave 3) is expected in the near future, we shall see. Here are a couple of video links and a couple of charts to consider. Caution is warranted, just my take.

https://www.youtube.com/watch?v=-D8boUqneAI

https://www.youtube.com/watch?v=BRypPQ1dscI

S&P 500 (C Fund)
sc.png

VIX
sc (1).png
 
Back
Top