MrJohnRoss' Account Talk

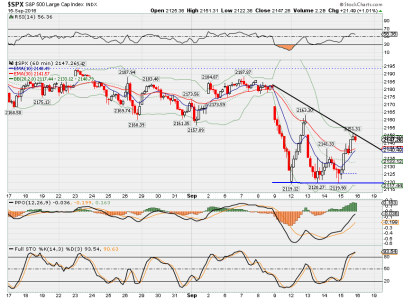
S&P lost 52 points on the week, and is short term oversold. On the 60 min chart, the S&P has a RSI under 16, which is very oversold. Although futures are pointing to a lower market tomorrow morning (Dow -111 points as of this post), I wouldn't be surprised to see buyers step in to take the market higher by closing.

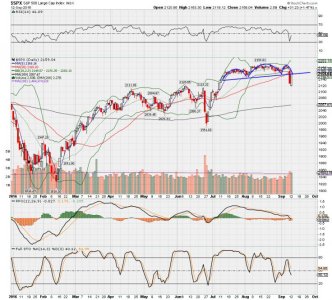
As expected, we got our oversold bounce. Here's how the S&P looks now, from the broken neckline:

spx.jpg

Looks like we've bounced back up to previous support at the neckline. (Previous support becomes resistance). If the market can take that neckline out convincingly, then the bulls have the upper edge. If not, expect more downside in the near future.

Oil looks like it's continuing it's volatile move lower, so my guess is the market will follow suit. I find it rather amazing that the Fed merely hints at a rate hike, and the market tanks, and the next trading day, they ease up the talk, and the market skyrockets. Ridiculous.

Composite system remains at -3.

Good luck!
 
Another big down day. (It would have been a REALLY bad day if AAPL hadn't jumped higher by 2.4%! That saved the market from being down over 300 points).

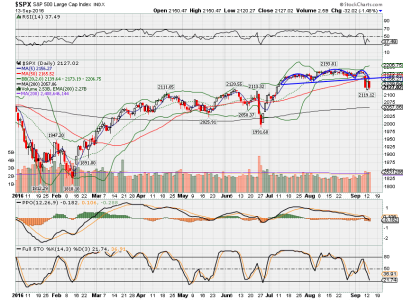
Doesn't look like that neckline resistance wants to be taken out. At least not at this point:


spx.png

Oscillators are looking weaker by the day. I still think that the Fed is NOT going to raise interest rates before the election. Just too politically risky. So I think the market will skyrocket when they make the announcement that there will be no raising of interest rates at least until December. Until then, bad news is good news, and good news is bad news.

Composite system remains at -3.

Good luck!
 
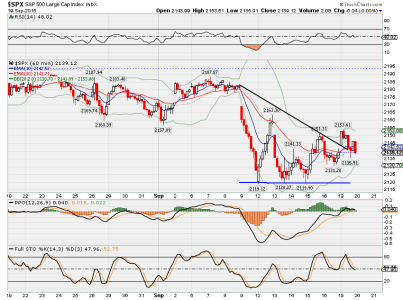
60 minute chart is detailing a bearish descending triangle:


spx.png

If prices crack below the bottom of that triangle near 2120, we could see a more significant decline. A gap fill and return to the 2180 area would negate this pattern.

Once again, we had AAPL (+3.54%) saving the indicies from a more significant decline. Bullish percent indicies for both the Nasdaq and S&P have cracked the 20 DMA, and are heading lower. Not a good sign. Oil took a beating today as well.

Oscillators remain negative, and the composite system remains at -3.

Good luck!
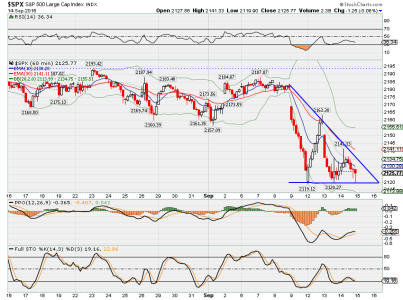
 
Yep, 2120 is the line in the sand. As long as we hold that line, we've got a fighting chance. snort snort...
swordfight.gif
 
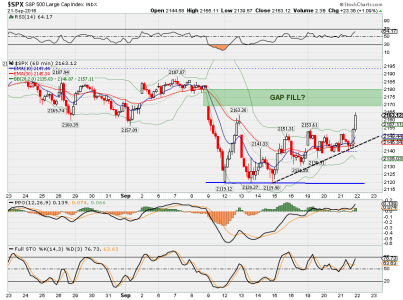
Nice little 1% rally today, but not enough to clear the previous high.


spx.png

I moved the upper line of the descending triangle to fit today's prices. AAPL has once again saved this market. Nasdaq is looking very strong.

The market needs to clear the previous high at 2163 to give the bulls a leg to stand on. Otherwise, it still looks like the market has a negative bias.

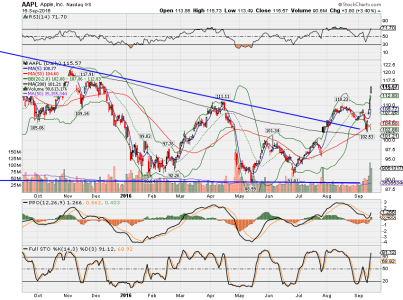
If you haven't seen a chart of AAPL lately, it's pretty impressive:


aapl.png

Note the volume on that launch higher. Obviously that trajectory can't be sustained forever, so I'd expect a pullback soon.

Meanwhile, the composite system remains at -3.

Good luck!
 
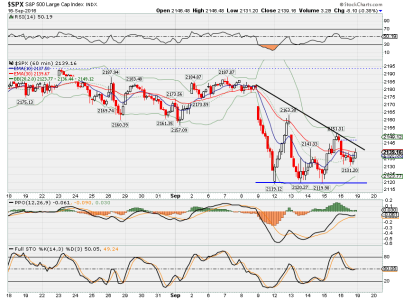
Updated 60 min chart is showing that the bearish descending triangle is still intact:


spx.png

Prices moved lower into the triangle, so we'll need to resolve it, most likely by next week. Today's headline news was mostly about Deutsche Bank (DB) getting hit with a $14 Billion fine. Yikes, that'll hurt. DB was down over 9% on the news. Banks and financial companies were hit hard, but there was red all over the US Industry Indicies. Virtually every major international index was down, led by Italy (-3.23%) and Germany (-2.22%).

As expected, AAPL had a pullback, although it was small. Bonds (AGG) appear to be forming a bottom cup as yields look like they may have formed a short term peak.

The VIX, which had been over 20 this week, has now dropped to 15.37, and has triggered a bullish crossover. My composite system now stands at -1, a sell/hold signal.

I have a busy weekend planned, but hope to look at some long term charts and get them posted.

Hope you enjoy the last full weekend of summer!
 
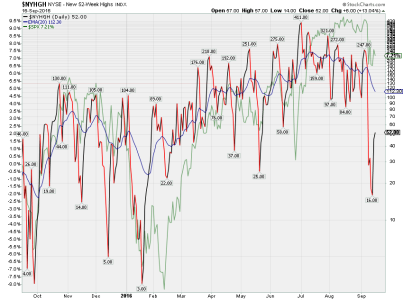
Chart of NYSE new highs:


nyhgh.png

New highs peaked in early July, and have been trending lower since. The 20 EMA is a good proxy for the trend, and it's dropping fast. There were 411 new highs on July 1. Last Friday there were only 52, and only 16 on Wednesday. Out of a universe of about 2,800 stocks, that's not too healthy. Note the divergence in new highs, which have been heading lower since July, and the S&P (in green), which has continued higher until just recently. Just another sign that things are looking sketchy.

One last bit of data to chew on... according to Tom Bowley, the 2nd half of September is especially weak. Here are his stats:

"Here are the annualized returns for the NASDAQ since 1971 during the month of September, broken down by the first and second halves of the month:
September 1-15: +8.08%
September 16-30: -22.50%"

Good luck!
 
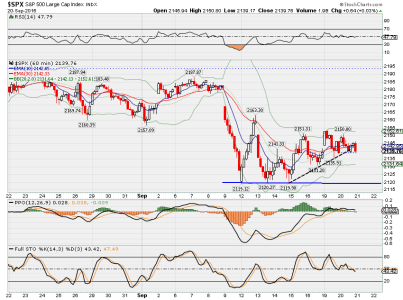
It was a "pop and drop" kind of day today:


spx.png

Previous resistance now becoming support? Could be. Tomorrow will likely be the deciding day on which way this market is going to go. The odds of a Fed rate hike are low, so perhaps it's already baked in to the prices. It *shouldn't* be a surprise to hear them say they're going to hold off until December. If they surprise us with a rate hike, we could get a mini sell-off.

Small caps did very well today, so that's a feather in the bull's cap. WTIC started out with a bang, but ended with a whimper. Momentum is still down for oil, and as oil goes, so goes the market. At least most of the time.

No changes to the composite system. Still holding at -1.

Good luck!
 
Rising bottoms trendline has taken the place of the descending triangle in the 60 min chart:


spx.png

The last 10 minutes of trading was a hard down move... not a good sign for the bulls. Perhaps we'll get "good news" from the Fed tomorrow, and that big down gap will get filled to the upside. Since the "experts" have placed the odds of a rate hike so low, it shouldn't be a big surprise to hear them say they're standing pat at this time, but who knows what kind of shenanigans the central banksters might pull.

Composite system remains at -1, as we await the word from the Fed, and also the BOJ. We could see a lot of volatility, but generally speaking, Fed days are usually positive. However, seasonality says the market should face some stiff headwinds all week, so it's definitely a guessing game at this point.

Good luck!
 
Perhaps we'll get "good news" from the Fed tomorrow, and that big down gap will get filled to the upside. Since the "experts" have placed the odds of a rate hike so low, it shouldn't be a big surprise to hear them say they're standing pat at this time, but who knows what kind of shenanigans the central banksters might pull.

Shenanigans indeed.


spx.png

The next target is that big gap fill area, and then the high near 2195. Why worry about a December rate hike now, when we can party like it's 1999 for a little while longer?

BOJ decision helped boost the yen, which is exactly what they didn't want to happen. Oh well *shrug*. The strong yen (falling dollar) helped gold, silver, and esp oil. WTIC up 2.93% today. Let's see if it's sustainable. JNUG up almost 23% today.

I'll be watching to see if the market goes up into the gap area tomorrow, or if it becomes resistance and fails to fill. It's make it or break it time for the bulls.

Composite system has switched to +1, a mild buy signal. Another day or two of strength could put the composite at a full buy signal. We shall see. Patience, patience. One day at a time my friends.

Good luck!
 
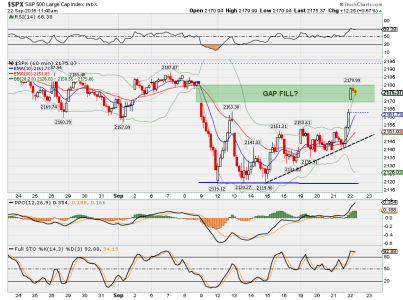
Looks like the gap has been filled this morning, but this morning's gap higher also leaves an unfilled gap, which may get filled to the downside.


spx.png

No telling what might happen this afternoon, but based on current oscillators, my composite system now stands at +3, a fully bullish position. I will enter the market this morning 100% S Fund as of C.O.B. 9/22/16.
 
Daily chart showing a breakthrough of the resistance line:


spx.png

A nice gap higher, but not much volume on today's move. Never the less, I'm guessing the path of least resistance is higher at this point. The previous high at 2193 is not far off.

Oil has had a couple of strong days, which has helped the market. Futures show oil down about 1% as of this post, so we'll see how things shake out tomorrow. Wouldn't be surprised to see a lower market with oil falling, and a possible gap fill.

Composite system stands at +3, a strong buy.

Good luck!
 
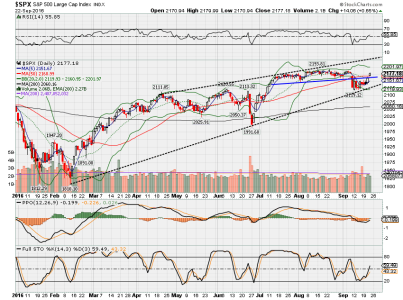
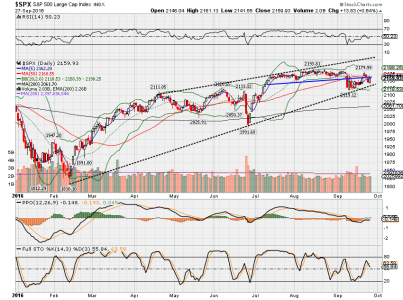
S&P continues inside the bearish rising wedge, but don't worry, we can party like it's 1999 until the lights go out.


spx.png

That blue support/resistance line has been giving the market fits. It's currently very near the 50 DMA, which is convenient for tracking purposes. Another sub-par volume day. Window dressing is going on in these last few days of the week/month/quarter, so I'm expecting a positive bias, especially the big name stocks.

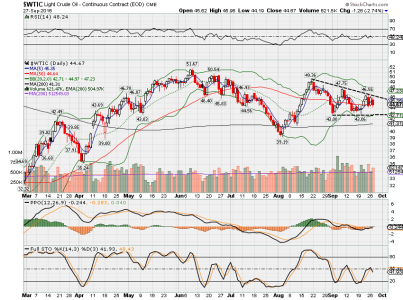
WTIC is tracking it's declining wedge, a bearish sign.


WTIC.png

Seems that the market has been tracking oil fairly closely (except for today), so it's a big caution sign in my book. On the other hand, the Nasdaq has been looking rather impressive, and is just 37 points away (give or take) from an all time high. So there's all kinds of conflicting signals with the markets at this time, and a lot of uncertainty.

I'll take it one day at a time, and see how things shake out. I have a feeling we might get some big moves as we get closer to the election, and then I believe the Fed will (finally) be forced to raise interest rates in December, so there may be more volatility as a result.

Composite system is reading +3, a full buy signal, so I'll stay fully invested for the time being.

Good luck!
 
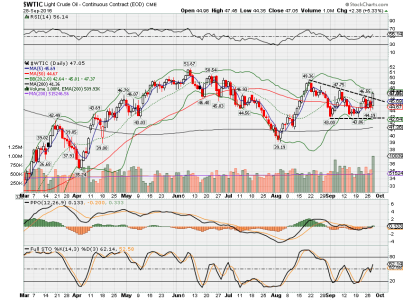
All eyes are now on oil, as it appears to be the catalyst that could propel the market higher. WTIC up over 5% today.


WTIC.png

Looks like there could be significant resistance near the 49-50 area. That will be a big test.

Markets like higher oil prices, so we'll see how long this rally lasts, and if it's got staying power, or if it's just a temporary OPEC deal that will eventually fall apart.

Meanwhile, the S&P was up 53 ticks today, and the R2K up 75. Surprisingly, the Nasdaq was up only 24 ticks. It's got some catching up to do tomorrow. *wink*

Composite system remains at +3, a strong buy signal.

Good luck!
 
I thought we were going to get a big follow through in the markets today. For now the futures say otherwise. Maybe it's due to Goldman's report on oil?
http://www.cnbc.com/2016/09/28/gold...-change-oil-price-forecasts-through-2017.html
The OPEC deal to cut oil production may provide a short-term support for prices, but chances are it won't change the supply outlook much, Goldman Sachs said.

Goldman said in a note to investors that it was sticking with its forecasts for WTI at $43 a barrel for the end of this year and $53 a barrel in 2017. The investment bank had cut its year-end forecast this week from $50 a barrel.

All eyes are now on oil, as it appears to be the catalyst that could propel the market higher. WTIC up over 5% today.


View attachment 39540

Looks like there could be significant resistance near the 49-50 area. That will be a big test.

Markets like higher oil prices, so we'll see how long this rally lasts, and if it's got staying power, or if it's just a temporary OPEC deal that will eventually fall apart.

Meanwhile, the S&P was up 53 ticks today, and the R2K up 75. Surprisingly, the Nasdaq was up only 24 ticks. It's got some catching up to do tomorrow. *wink*

Composite system remains at +3, a strong buy signal.

Good luck!


Back
Top