MrJohnRoss' Account Talk

The market appears to be in one of two modes, either a topping process, or a consolidation before a move higher.


View attachment 38983

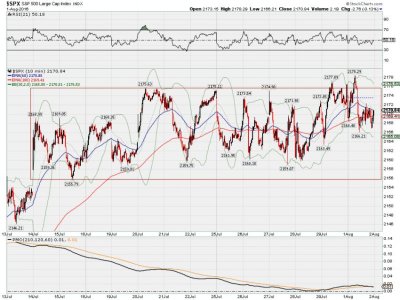
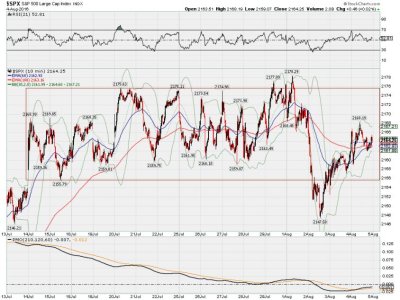
The short term chart (10 min) shows Friday's price action is beginning to look like it finally wants to break out of "the box" to the upside, which is positive. The negative is that it still closed within the box after failing to convincingly exceed that 2175 level.

And why did the market have a positive bias on Friday?? Oh yes, perhaps it was because the U.S. economy grew much less than predicted for the 2nd quarter, only 1.2% vs a 2.5% forecast. Wow, great news. Pop those stocks higher, will ya?

Never the less, the short term moving averages are showing a bullish move, and the short term PMO has also switched to a bullish position. All three of the main oscillators I watch are within a gnats ass of bullish/bearish positions (technically at -1), but it wouldn't take much to move them either way.

For the week, the S&P was down 0.07%, and for the month, up 3.56%.

According to Mike Burk, the S&P has historically been up 59% of the time in August, with an average gain of 0.6%. However, during the 4th year of the presidential cycle, the odds improve to 73% up, with an average gain of 3.0%. Something to chew on.

Best of luck to you this coming month!

Which one is it? :smile:
 
Which one is it? :smile:

At this point, it's almost a flip of the coin. My point was that you could make a case for it going in either direction.

If I had to guess, I'd say that the odds favor a break to the upside. But there's also the possibility that any rally from here could be short lived, and we could fall right back below the box.
 
The market tried (once again) to break out of "the box" today, but failed to close above it.


spx.jpg

Seems to me that if oil continues it's waterfall decline, it'll be hard for the market to climb much higher. The S&P is range bound, but the Dow and the Trannies have been sinking. Meanwhile, tech has done very well, so the Nasdaq has been climbing.

All my oscillators are twitching around the zero line, some days positive, some days negative. Currently the composite sits at -3, a full sell signal.

Let's see if the next day or two we can get some resolution one way or the other.
 
At this point, it's almost a flip of the coin. My point was that you could make a case for it going in either direction.

If I had to guess, I'd say that the odds favor a break to the upside. But there's also the possibility that any rally from here could be short lived, and we could fall right back below the box.

I was just kidding with you.
 
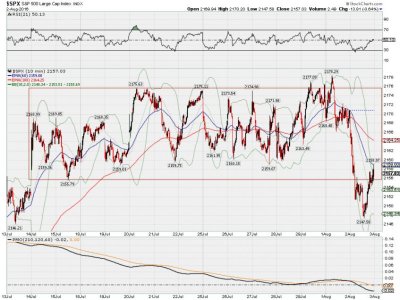
A very negative day for the markets, and yet the S&P still managed to close within "the box".


spx.jpg

Well, just barely. Looks like my composite system went full bearish -3 yesterday at just the right time.

Oil appears to be the main catalyst, although a case could be made with a multitude of other global issues, including European banking woes.

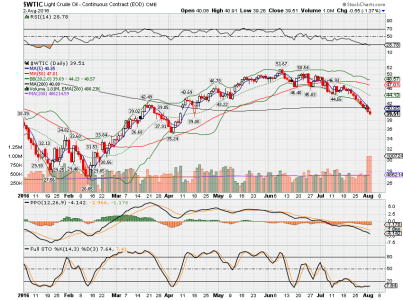
Chart of oil (WTIC):


WTIC.png

We're now below $40, which is considered bear market territory, since it's more than a 20% drop (-23.5%) from the $51.67 high. There may be support at $35.24, but if that doesn't hold, we might re-visit the old lows near 26.

Tighten your seatbelts, we might be in for a bumpy August. Composite system remains at -3, a full sell signal.
 
Up 31 ticks from yesterday. We're now at 16 straight daily closes within "the box".


spx.jpg

Markets appear to be trying to avoid a slide lower, but most of my oscillators are looking like the slide lower should continue, despite an occasional up day like today. Lower highs, lower lows.

Oil had a strong day, despite a rise in the dollar. WTIC closed at $40.83. Keep your eye on WTIC; that may be one of the main keys to the market's direction.

Composite system remains at -3, a strong sell signal.
 
Okay, 17 straight closes within "the box". I don't know about you, but I'm about ready for this pattern to end. As the ol' saying goes: "either sh*t, or get off the pot."


spx.jpg

Perhaps tomorrow's unemployment data will shake the market loose. The question is, will good news be bad news, or will it be good news? And vice versa.

Oil looks to be trying to find support near $40. Will it hold, or is this just a bump on the way further down?

Composite system remains at -3, a strong sell.
 
Looks like it gapped up and out the top of the box... now what? I think they're still cooking the books on these numbers...
 
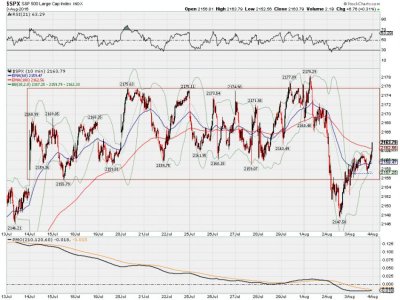
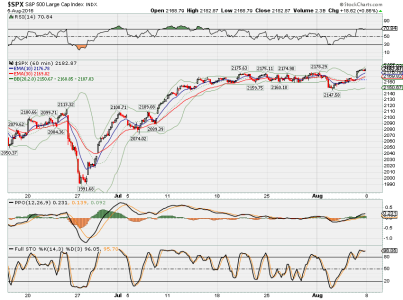
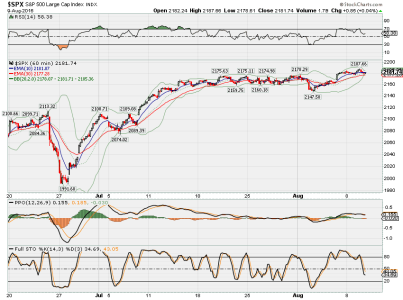
We (finally) have lift-off. 60 minute chart:


spx.png

A couple of things to note: We first had a head fake down to the 2147 area. Now we've closed above the box near 2183. Is this another head fake, and will the market settle back into the box, or is this move higher for real?

One positive point is that the market closed at the high of the day (HOD). Can't get much more bullish than that. Mr VIX collapsed all the way down to 11.39, and has triggered a buy signal as part of my composite system. (It's usually the fastest oscillator, but can lead to false signals). My other oscillators are still in "sell" range, but another positive day could push them into the green.

One day at a time. Let's see how things shape up on Monday.

Composite system is now at -1, a mild sell signal.
 
My concern: The worst thing about the VIX is that it closed outside it's lower Bollinger Band which could indicate some pullback before a continuation on to 2200.

Otherwise, the conditions still look good out there..

FS
 
My concern: The worst thing about the VIX is that it closed outside it's lower Bollinger Band which could indicate some pullback before a continuation on to 2200.

Otherwise, the conditions still look good out there..

FS

Well said FS. The VIX is ridiculously low. It's like sailing on seas as smooth as glass - we know eventually the sailing is going to change for the worse.
 
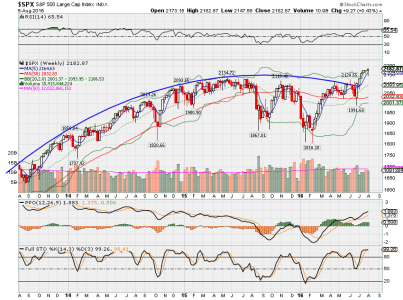
I like to look at the longer term charts on the weekend. Here's a weekly view of the S&P:


SPX Weekly.png

Even though we haven't had strong momentum the last few weeks, the trend has definitely been up. The PPO is looking very healthy, and the RSI is only moderately high at 65.

Perhaps the "invisible hand" will move the markets higher through election day to make sure everything seems good and prosperous. Eventually the ugly truth will come out, but until then, enjoy the ride.
 
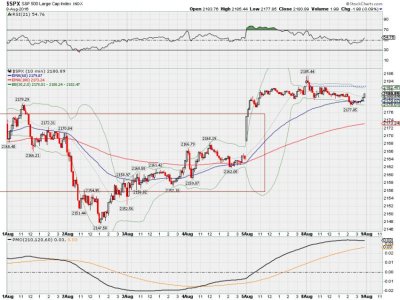
10 minute chart of the S&P showing that we're in another tight range.


spx.jpg

With the strong bounce in oil, you would think that the markets would be rocketing higher, but that's not the case.

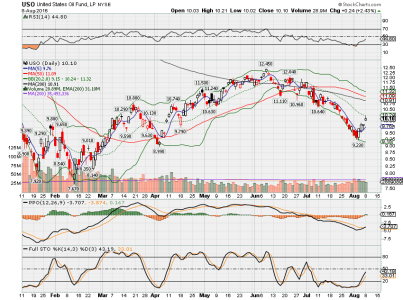
Daily view of USO:


uso.png

Oil is getting it's oversold bounce from an RSI that dipped below 30. Apparently, there is "speculation" that the next OPEC meeting might result in an "attempt to stabilize the oil market". Good luck with that. The last time OPEC met, it was a total catastrophe, because the Iranian's and Saudi's couldn't agree on a damn thing. Oh well, give it the 'ol college try I guess.

None of the oscillators I track changed position, therefore my composite system remains at -1, a mild sell signal.
 
Another day, another tight range. 60 minute chart:


spx.png

Nasdaq is looking strong, but Mr Tran has bounced up and down and round and round since mid March, going nowhere. The Dow had one good day (Friday) in the last few weeks; other than that it's done a whole lot of nothing.

Keeping my eye on WTIC (USO). I think it may hold the key to which way the market goes.

Composite system remains at -1, a mild sell signal.
 
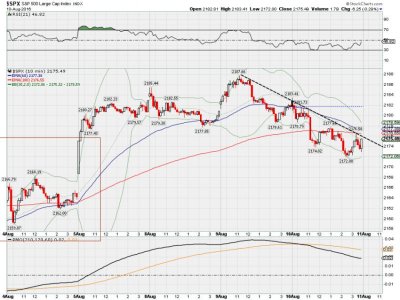
10 minute chart showing declining tops:


spx.jpg

Apparently, all the hoopla about yesterday's new all time high at 2187 was quickly forgotten. Oil still seems to be the main driver of this market, at least for the moment.

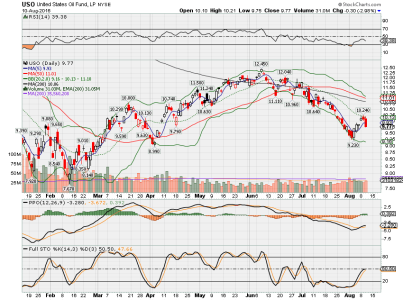
Chart of USO:


uso.png

Looks to me like the bounce that occurred last week was of the dead cat variety. The big gap higher on Monday has now been filled, and things are looking bearish for oil at the moment, which may not be a good sign for stocks. Even today's drop in the USD didn't help oil, but did help other commodities, especially metals.

My twitchy VIX system has now triggered a sell signal, which puts my composite system at -3, a strong sell signal.
 
Just a short update this evening, as I had an injury today, and am in a great deal of pain. The market eeked out a new high, but my composite system remains at -3. Oil bounced higher on speculation that OPEC members might want to seek a deal on putting a cap on production. That's all it took... speculation. I think we all know that the odds of them agreeing to curbing production is next to nil. Ah well, onwards and upwards. Tally ho.
 
Back
Top