MrJohnRoss' Account Talk

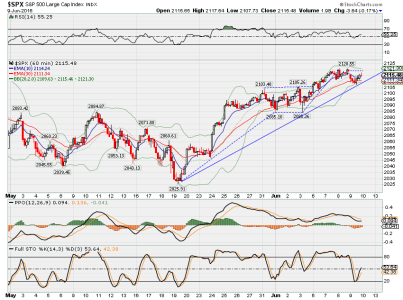
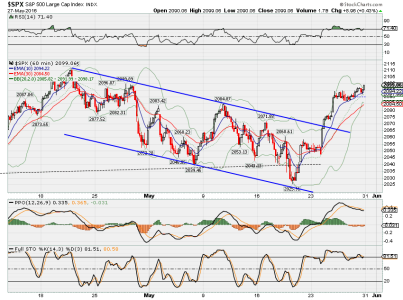
Here's a quick look at the 60 minute chart of the S&P:

spx.png

As I stated previously, prices couldn't stay in the channel forever. It was a surprise to see such a strong breakout to the upside. On 5/19, I said "Possible shooting star on the VIX today, which may indicate a reversal in the near future", which is exactly what happened, which caused my VIX timing system to flip to a buy signal. The others soon followed.

We're still in short term overbought territory (RSI, PPO, BB), so we may see a pullback or at least some consolidating in the short term. It's a positive to see prices close at the high of the day, but short term traders should be taking profits here, not buying into it at this point.

System reading remains at +3, a strong buy signal.
 
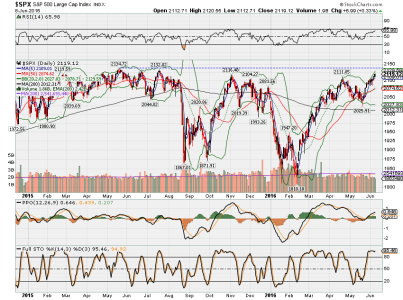
Daily and weekly views of the market:


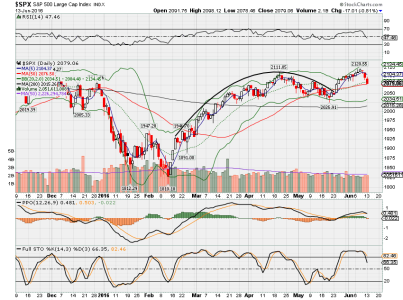
spx.png

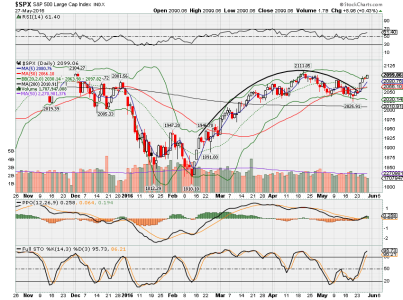
The big arching formation came to a sudden end on Tuesday, with a CoC (Change of Character) move higher. I don't know about you, but it was a surprising move to me. It makes no sense fundamentally, but since when does the market make sense? The market is going to do what it wants to do, and you just have to follow along. There is a possibility that this is just a bull trap, so keep that in mind.

The PPO and Stoch had bullish crossovers, and we're back above the 50 DMA, which is also above the 200 DMA, both bullish signs. As far as being overbought, the RSI is fairly high, but not excessive, and the PPO is neutral. We are at the upper edge of the BB, which may indicate a pause or consolidation here. The shorter term chart (60 min) is suggesting a likely pullback or consolidation.

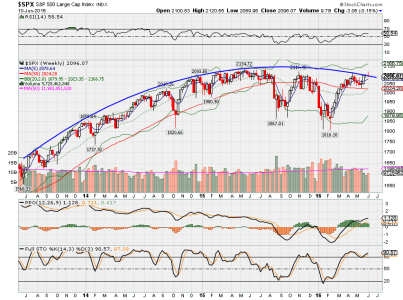
Now to the weekly chart:


SPX Weekly.png

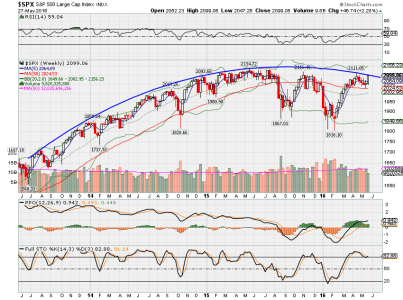
The giant dome continues, even with last week's surprising move higher. I would be suspect of a move outside this dome on a short term basis, as it could be a fake-out. That's why I'm thinking that this move might not have very long legs, and we may head lower in the not too distant future. One thing to note on this chart is the big move higher was accompanied by fairly weak volume (although traders could have been lighter due to the holiday). It'll be interesting to see what happens this coming week, as prices could get squeezed between the 50 WMA and that upper dome, or possibly even go above it (temporarily).

Finally, on this Memorial Day, I am reminded that "all gave some, and some gave all". May God bless them.
 
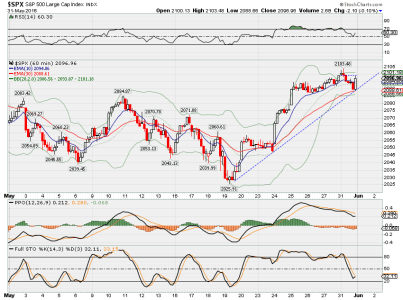
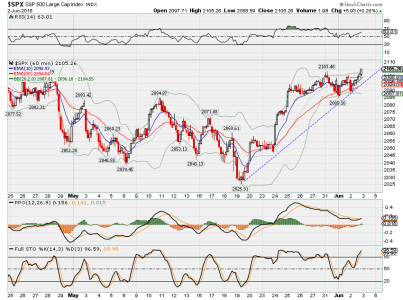
S&P 60 minute chart. Nice recovery in the final hour. Strong trend line from the 5/19 low.


spx.png

We're still mildly overbought (RSI, BB). Looks like the PPO is suggesting a pullback is coming, so I wouldn't be surprised if the trend line is broken tomorrow. On the other hand, typically the 31st and 1st days of the month are very strong (new money being put to work), so we'll have to see where the elephants in the room are going to lead us.

We're also bumping up against major overhead resistance in the 2111 area, so there may not be a lot of room to run. Also, with the market P/E ratio at multi year highs, it just doesn't make fundamental sense to have the market go much higher. (Not that fundamental sense is part of what this market is about anymore).

System readings remain at +3, a strong buy, although the VIX system was close to triggering a sell signal.
 
S&P 60 minute chart. Fake out, then a break out.


spx.png

Somehow we managed to stay above the rising trend line, but it's looking might precarious. I'm thinking we're gonna break it tomorrow, which could happen with just sideways consolidation.

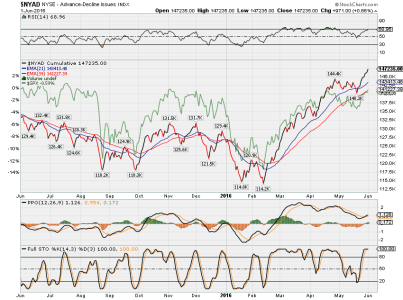
The other chart I was looking at tonight was the NYAD (NY Advance-Decline Line). After the April high, the A-D consolidated a bit, but didn't really break down. Since the May 19 low, the A-D line has had a hell of a ride higher, perhaps too much, as the RSI is suggesting the engine is about to over heat. OTOH, the engine took a lot of heat during the March-April rally, so maybe it'll do it again. Somehow I doubt it, as we're going to bump up against resistance near that 2111 area on the S&P, which isn't that far away.


NYAD.png


One other note, it's looking like oil (USO) may be reaching it's zenith, and is starting to gasp a bit. I'd keep a close eye on any oil holdings just in case we have a pullback.

As expected, my VIX system triggered a sell signal today. Composite system now reads (+1+1-1) = +1, a mild buy signal.
 
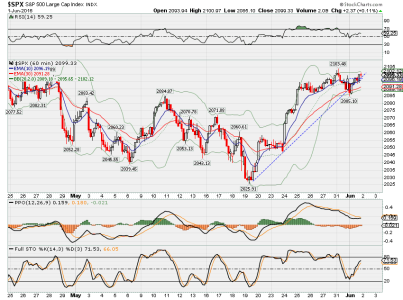
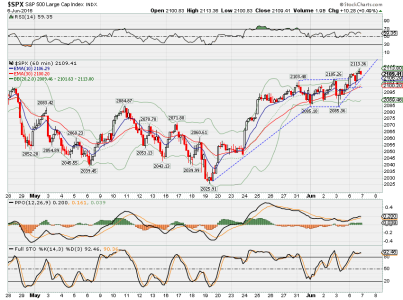
Updated 60 min chart. Another fake out and break out.


spx.png

I moved the uptrending line over to reflect today's prices. I am impressed that traders feel confident enough to run the market up at the close to the HOD. Must not be too worried about tomorrow's jobs report.

Although the RSI is high (63), it's not in dangerous territory. Prices did close above the upper BB, so that might be reason to pause. The 10 EMA is still above the 30 EMA, which is bullish. Even the PPO had a closing bullish crossover.

If I had to guess, I'd say tomorrow might close higher to end the week. There's just too much bullish momentum right now. Of course, if there's any kind of surprise in tomorrow's numbers, it could knock the market back down. Bad news should be good news, and vice versa, so a stellar jobs report might trip up the market, since it might (seemingly) increase the odds of a rate hike.

Composite system remains at +1, a mild buy signal.
 
We're now knocking on the door of 2111, the April high. Tomorrow may be the day we push through.


spx.png

After a big push higher through the 27th, the market consolidated for a few days to allow the RSI to reset back to normal operating temperature. It now looks like another push higher is in the cards. Forget that the market's P/E ratio is in nosebleed territory. It's time to damn the torpedoes, and steam full ahead!

Composite system is now sitting at +3, a strong buy signal.
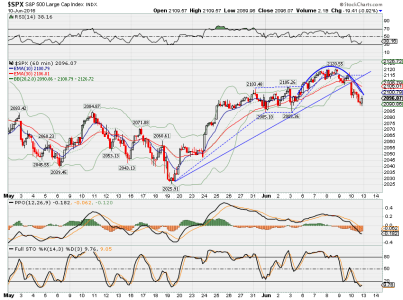
 
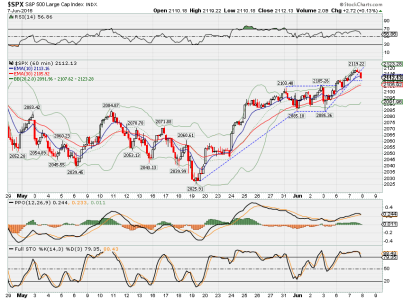
Well, now what? We broke through the 2111 April high, but today's roll-over close doesn't inspire much confidence.


spx.png

Now that we've passed through a seasonally strong period for stocks, the next few days (7th - 10th) have historically been weak. I'm guessing we'll at least consolidate here and digest these gains before heading higher.

My VIX system triggered a sell signal, and has a tendency to whipsaw, but also is good for giving advance warning on short term market moves. That puts the composite system at (+1+1-1) = +1, a mild buy signal.
 
This market does not want to consolidate, it just wants to run higher.


spx.png

That's all well and good, but eventually too much monkey juice is gonna kill the monkey. RSI is at 66, so there really isn't a whole lot more upside left before the "hot engine" light starts flashing at 70. The next resistance level is obviously the 2135 area, the all time high. My guess is we're going to get there soon, since the market just has too much upside momentum right now.

System remains at +1, a mild buy signal.
 
Monkey juice? What's that? I was born in the year of the monkey and would like to avoid overindulging. :D

I enjoy reading your posts even though I have no dinero in my TSP anymore; the info you provide helps with my personal accounts though.

Aloha Mr. JR. :smile:
 
Monkey juice? What's that? I was born in the year of the monkey and would like to avoid overindulging. :D

I enjoy reading your posts even though I have no dinero in my TSP anymore; the info you provide helps with my personal accounts though.

Aloha Mr. JR. :smile:

Aloha to you, KK. Monkey juice is most likely M1 money supply and other nefarious money pumping going on between the Yellen and Co. and the big banksters, so I think you're safe.

Feel free to indulge, you've earned it. Thanks for stopping by! :wink:
 
Almost decided to jump out of stocks today. Almost. Instead, I decided to stick with my system. Maybe if we all concentrate reeeeaaallly hard, we can bust through 2135, and keep climbing to the moon with pockets full of money.


spx.png

Today was a necessary pullback or at least a consolidation day. That uptrend line is pretty steep, but hey, this market wants to go higher, so stand back and let it rip. Meanwhile, the P/E ratio is being shot out of a cannon as far into the clouds as it can possibly go. Bubble? Nah. Overbought? No way. Time for a pullback or (gasp), a correction? You'd be the laughing stock of the party if you weren't clinking your glasses together as the market continues to go higher.

Personally, I think this latest rally from the May 19th low is a bubble on top of a bubble, but what do I know. If we take out the all time highs at 2135, (only 20 points away), what does that tell us? That all is fine in this massive debt induced parabolic bubble economy? Of course! Nothing to worry about, right?

System remains at a +1 level, so I remain in stocks, with one foot straddling the doorway, ready to leave this party if things start to turn ugly.
 
Ruh-roh. My systems won't have a final reading until the end of the day, of course, but I'm anticipating negative crossovers. The F Fund is on a tear, but the RSI is in dangerous territory (72), so I'm playing it safe by going to the G Fund.
 
Well, yesterday I said: "System remains at a +1 level, so I remain in stocks, with one foot straddling the doorway, ready to leave this party if things start to turn ugly." Sure enough, the bears came crashing in, and I hit the escape button.


spx.png

For the week, we started out strong, but ended up with a slight loss (-0.15%).


SPX Weekly.png

That puts the latest weekly candle back underneath the massive dome, right where it belongs. If the market continues along the path of this dome, expect lower highs and lower lows over the next few weeks.

Composite system now reads (+1-1-1) = -1, a mild sell signal, and the only system with a +1 is just a fraction away from joining the others on their sell signal.
 
Bad day for the markets, especially that close very near the LOD.


spx.png

The good news is that the "cold engine" light came on (RSI below 30), so it's one reason I might expect a rebound in the markets tomorrow.

The daily chart is looking like the trouble is just beginning.


spx.png

After failing to hold the short term 2085 level, it sure looks like the next test of support might be the May low around 2025. If that test fails, then Katy bar the door. The other short term positive sign for the markets was the huge gap higher on the VIX. Unless we're going into crash mode (which I doubt), I'm guessing that's a sign of short term fear exhaustion, and the VIX should ease lower tomorrow, which should help the markets stabilize in the short term.

Oil is finally starting to crack through the ice, and looks to be heading lower. That's caused the high yield bond market to start tanking, which it needed to do anyway, as it was way overbought with an RSI well over 70 last week. The Nasdaq is looking especially weak, which is not a good sign, and Mr. Tran is also starting his move lower. Watch the 7470 level on the TRAN. If it breaks below that level, it could spell trouble.

Composite system is a full negative 3, a strong sell signal.
 
Mr Market got a little too oversold today, so it turned around and staged a bit of a comeback, only down 18 ticks.


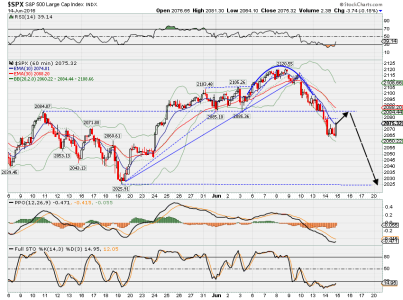
spx.png

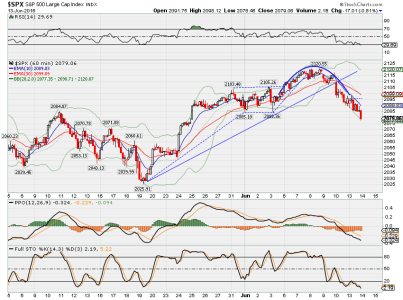
Note the RSI got well below 30, so the warning light got short term traders attention, and the rally began. My guess is we get a short term bounce, possibly testing the 2085 level (first black arrow), and then we resume the downtrend harder, possibly testing the next area of support around 2025 (2nd black arrow). Lets see how it plays out over the course of the next few days.

EFA is getting creamed, so I Fund holders are hurting big time. AGG is looking toppy, and the RSI is still over 70, but rolling over. Maybe the best long term hold this year is the F Fund, for those of you who like to set it and forget it. Worldwide bond yields are going lower everywhere, and it's causing a flight to yield.

Mr TRAN took a big hit, down 145 bp, and USO continues to slowly sink.

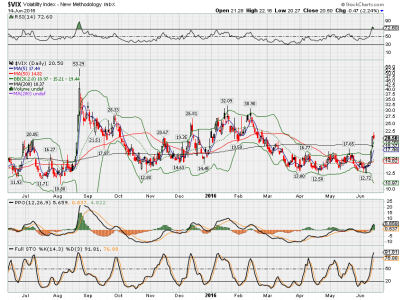
As expected, Mr VIX closed lower, and printed a shooting star red candle lower. Interesting to note that only twice in the last year has the RSI for Mr VIX been over 70, and this is one of those times. I'm expecting a lower VIX for a few days before more fireworks go off.

vix.png

Composite system remains at -3, a strong sell. However, I wouldn't be surprised if my VIX system (ultra short term) changes course and closes with a bullish crossover tomorrow or the next day.
 
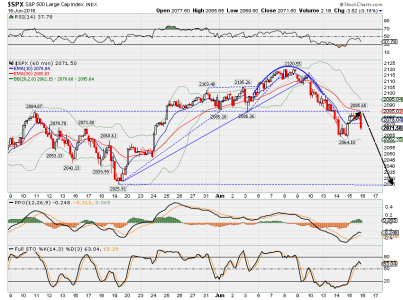
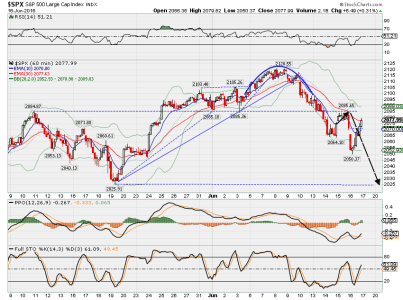
Right on cue. Mr Market tested previous support (now resistance) at 2085, and immediately dropped like a stone.


spx.png

That sure is an ugly big red candle down in the final hour of trading, which is not a good sign. Short term indicators are not especially oversold at this point, so we could see more downside tomorrow. 2025 seems to be the next logical test for the market, which would be a drop of a little over 2% from here.

Mr VIX did drop lower, as expected, but not enough to trigger a signal switch. Composite system remains at -3, a strong sell.
 
Mr Market got a bit too oversold right at the open (RSI below 30), so traders jumped on it.


spx.png

That brought the market climbing back throughout the rest of the day. I'm still believing that this is a counter-trend rally, and we'll have more downside to go, but the market likes to surprise us, so be prepared for high volatility.

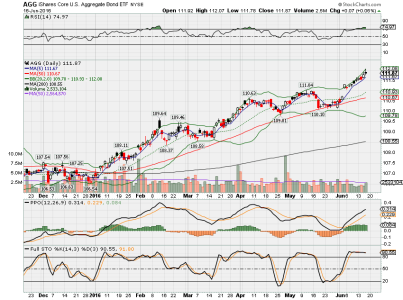
Bond yields continue to sink, and the F Fund is reaping the benefits. I'd be cautious about buying in at this point, with the RSI at 75 for AGG. The "hot engine" light is flashing red, so be careful, or you might get burned.

agg.png

Today's falling VIX has caused a bullish crossover for my VIX system (ultra short term), but my composite system still reads -1, so I'll hold short (cash).
 
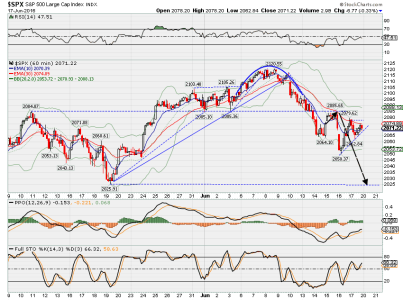
Mr Market dropped, then staged a recovery. We now have a series of higher lows and higher highs over the last two days on the hourly chart.


spx.png

Apparently, the attack on the young MP in England has caused the markets to think Brexit might be delayed or voted down. The countertrend move in oil also helped the markets, although the Nasdaq is sucking wind and looking awfully weak.

In any event, if we go much higher on Monday, it could trigger a short term buy signal. I'm still expecting a test of the 2025 level. It's just taking a more circuitous route than was expected.

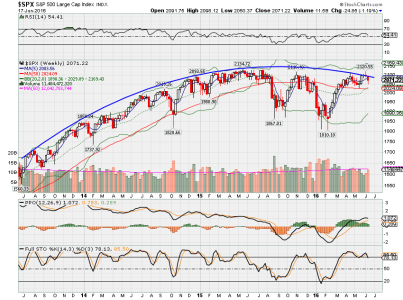
For the week, we moved down (-1.19%) which was expected. Prices remain under the massive dome.


spx.png

Next week will be a fun one to watch. If Brexit gets voted down, I expect the markets to shoot up like a rocket, possibly 2-300 points on the Dow. If it goes the other way, it could be a long road of uncertainty lower for the markets all summer.

Composite timing system remains at -1, hold short.
 
You Are Here - The Burning Platform


..."The current crisis revolves around the core elements of debt, civic decay and global disorder. The 2008 global financial crisis, manufactured by the Fed and their Wall Street puppeteers, was catalyzed by hundreds of billions in bad debt issued as part of the largest control fraud scheme in world history. The brunt of this banker formulated disaster has been borne by the former working middle class and senior citizens dependent upon interest income to survive in an inflationary world. The initial threat of full-fledged collapse was deferred through extreme monetary and fiscal actions by the establishment vassals, as they created trillions in new debt to fill the vortex produced by the trillions in bad debt...."
 
Back
Top