MrJohnRoss' Account Talk

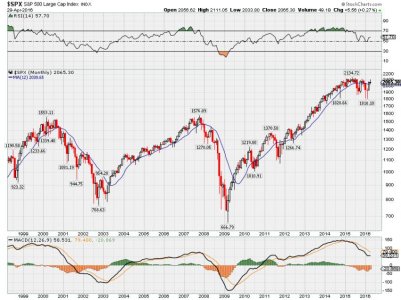
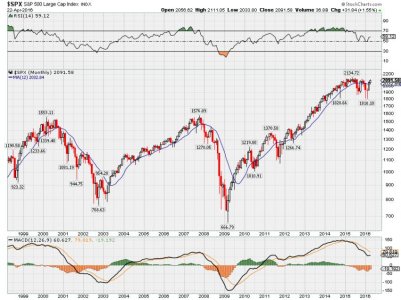
Long term monthly chart of the market:
spx.jpg

Seems that the market is struggling to make higher highs this week. We're in the resistance area of the previous highs from last November, so cautious investors are cashing out. We've got one more week to see how the final monthly candle prints on this chart. So far we're up 1.5% for the month, but anything can happen between now and next Friday. Short term momentum seems to be waning. Longer term, as viewed from this chart, suggests it may be wise to remain cautious.

Last October had a big white candle with an 8% gain which took it over the 12 month MA. That was followed by a flat November, which was followed by three big down months.

This year, we had March with a big white candle with a 6% gain which again took it over the 12 MMA. It's possible we may finish out this month flat or with another very small gain. How the month finishes may be an omen to how the next few months play out. I wouldn't be surprised to see a return to lower lows for stocks over the next few months.

USO is struggling to make new highs. The dollar looks like it may be strengthening. I'll be keeping my eye on the Fed for Hawkish clues, as well as a possibly strengthening dollar and how oil plays out next week.
 
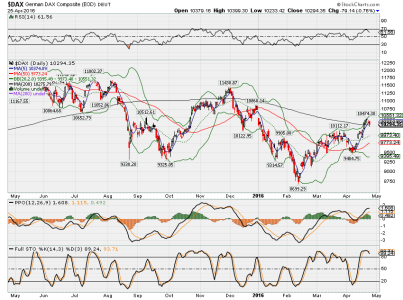
A quick look at the German DAX:


DAX.png

The DAX and the S&P are highly correlated, even though the DAX has not had nearly the rebound this year that the S&P had. While the S&P is up near last November's high, the DAX is still about 10% below last November's high. Many experts believe that our markets are WAY over priced in terms of current P/E ratio's.

If the German market rolls over here, like it appears to be doing, it could foretell what may happen here as well. Just something to keep your eye on.

All three of my systems are now is sell mode (-1-1-1) = -3 a strong sell signal. Surprised to see bond yields rising with this weak market. The F Fund should be doing better than it is. Hopefully this screwy market will straighten up and act rationally soon. (Hahaha - yeah right).
 
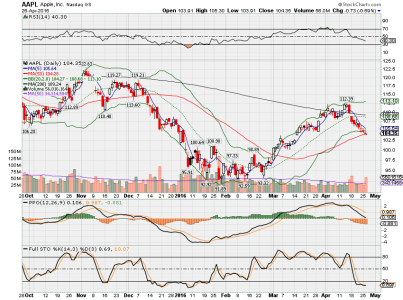
Chart of AAPL:


aapl.png

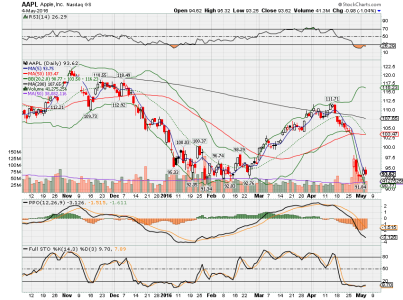
AAPL had a nice run up from the February lows around 92, but it got extended too far when the RSI warned of a top. Sure enough, one last push to the 112 area, and the goody balloon popped, as evidenced by the bearish engulfing candle, followed by a gap down, and lower lows every day since. Tomorrow will likely see another (big) gap down, which will of course bring down the Nasdaq and S&P. The chart of AAPL looks very bearish, with the 50 DMA below the 200 DMA, and the complete failure of prices even coming close to reaching it's highs from last November near 122.

Sellers may come out early tomorrow, but we'll have to see how the rest of the day plays out. Whether or not big money comes in to buy shares will be the key. Of course, Cook and company may spend a few billion propping up their shares, so anything is possible. My guess is we're likely to test the previous lows in the 92 area. If it can't hold there, AAPL is cooked. (Pun intended). Not a good omen for the market in general.

My three systems remain at (-1-1-1) = -3, a strong sell signal.
 
MJR thanks for the info. I am directly affected by this downfall. It sure looks ugly, but Apple has been ify for awhile now. Good luck to all those APPL holders.
 
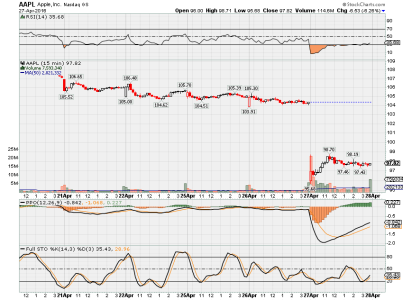
15 minute chart of AAPL. As expected, a quick plunge at the open, a slow rise higher, followed by slowly sinking prices and a flat line the rest of the day. This isn't just happening to AAPL. Take a look at the daily charts of tech giants GOOGL and NFLX. They've already fallen off the cliff, and might be a road map for what happens to AAPL.


aapl.png
 
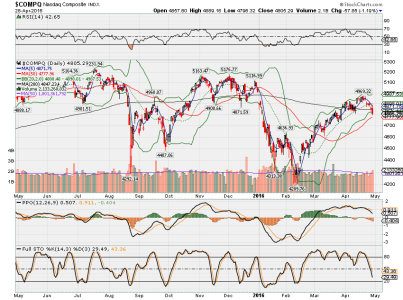
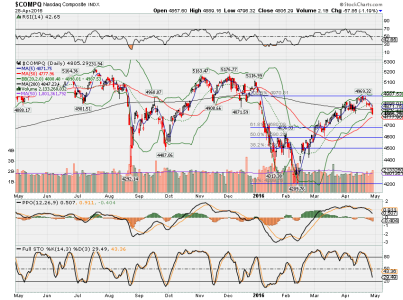
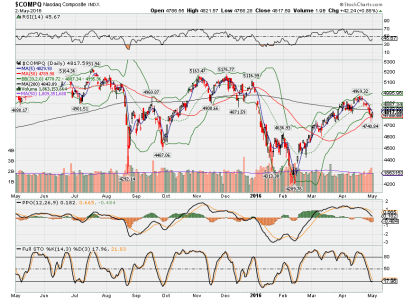
Sure looks like the markets are beginning to roll over. Nowhere is this more evident than with the Nasdaq:


nasdaq.png

The first level of support might be the 50 DMA. After that, the Fib ratios are close to 4700, 4600, and 4500.

Sell in May and go away just might be good advice.
 

Attachments

  • nasdaq.png
    nasdaq.png
    49.1 KB · Views: 269
Sure looks like the markets are beginning to roll over. Nowhere is this more evident than with the Nasdaq:


View attachment 38107

The first level of support might be the 50 DMA. After that, the Fib ratios are close to 4700, 4600, and 4500.

Sell in May and go away just might be good advice.

Or it could be contrarian. :D

But love (well, really like) your posts John. Keep them coming.
 
Monthly long term chart of the S&P:


spx.jpg

After all the hoopla, April turned out to be a dud performance for the markets, as it left with it's tail tucked between it's legs. As I stated on my 4/22 post:

"Last October had a big white candle with an 8% gain which took it over the 12 month MA. That was followed by a flat November, which was followed by three big down months. This year, we had March with a big white candle with a 6% gain which again took it over the 12 MMA. It's possible we may finish out this month flat or with another very small gain. How the month finishes may be an omen to how the next few months play out. I wouldn't be surprised to see a return to lower lows for stocks over the next few months."

Of course anything can happen with the markets, including Fed manipulation, er, I mean intervention, to levitate stocks. But just looking at the charts, it looks like a downturn is just getting warmed up in the wings.

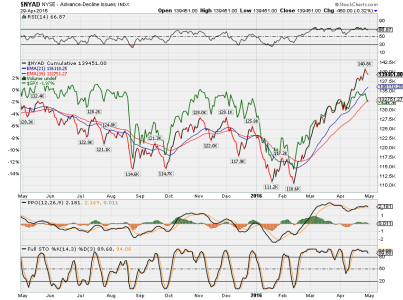
The last hour of trading today was impressive, as bulls tried to corral stocks back into an uptrend. We'll have to see how Monday plays out, as the first trading day of the month is typically a bullish day. Keep an eye on the cumulative NY Advance Decline line, (below) as it's still in an uptrend, but ridiculously over bought (RSI, PPO). Also note that the over the last year, the S&P has a return of -1.97%. Yikes!

NYAD.png

Commodities continue to climb, including oil and the PM's. The dollar is going south fast. 10 Year T-Bill Yields look to be heading going back down, sending bond prices higher. Nasdaq is trying to hold on to the 50 DMA with it's fingernails, but looks like it's going to go down the flusheroo. Mr. Tran is looking very weak, and today it fell hard.

So here's my guess on the market next week: Wouldn't be surprised to see a mild up day on Monday, followed by more downside action for the rest of the week.

Good luck!
 
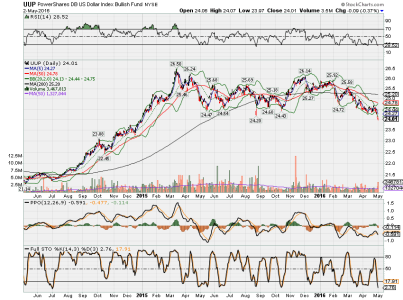
Chart of the dollar index (UUP):


uup.png

UUP broke important long term support today at 24.20. There's a lot of dead space below it. The falling dollar should help commodities and commodity related stocks.

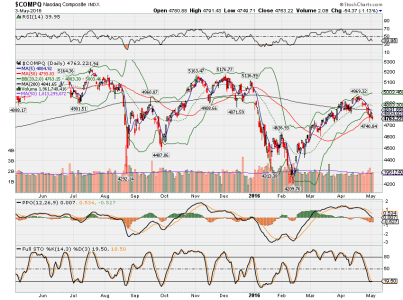
As expected, the markets had a positive day for the first trading day of the month. It will be key to see how well it does over the rest of the week. I'm thinking it's just a bump in the road on it's way down. Nasdaq has some pretty negative momentum here, even though it rose today.

nasdaq.png

I'm still holding on to the theory of a negative week for stocks. All three systems remain at (-1-1-1) = -3, a strong sell signal.
 
Updated Nasdaq chart:


nasdaq.png

Down another 54 points today, and down a whopping 206 points from it's 4/20 high. (Ha! 4/20 high - no pun intended).

We can kiss the 50 DMA goodbye. Next level of support is near 4700, where the first Fib ratio lies.

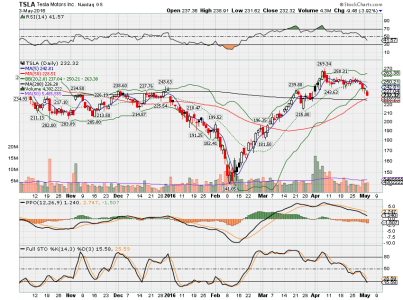
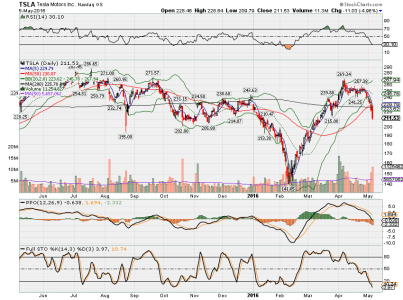
You may have seen the article about Tesla Motors (TSLA) stock being ridiculously valued at $620,000 per car it delivered last year. It's valuation is roughly 125 times the next 12 months of expected earnings. I'm surprised the stock didn't climb higher on the news, the way irrational exuberance has been flowing around the market these days. For some strange reason, the stock fell almost 4% today, and should help bring the Nasdaq down further. Anyone watching this stock should have seen the overvalued RSI, and then the PPO crossover to save them from it's downfall.

tsla.png
 
Interesting! David Gardner of The Motley Fool was on Wealthtrack last week sounding a BUY on Tesla Motors. I guess we were the fool if we took him up on that. :rolleyes:
 
Interesting! David Gardner of The Motley Fool was on Wealthtrack last week sounding a BUY on Tesla Motors. I guess we were the fool if we took him up on that. :rolleyes:

Those Motley Fools are about as worthless as Jim Kramer. None are ever right about anything.
 
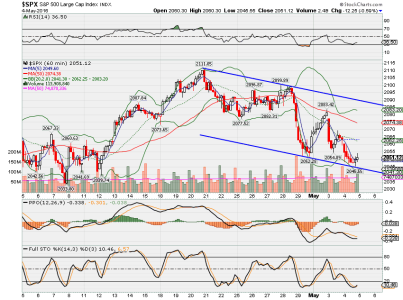
60 minute S&P:


spx.png

I've drawn a parallel price channel with the top line connecting the lower highs from the 4/20 high. A couple of oversold RSI areas (below 30) brought some buyers in, but only temporarily. The trend is definitely down. Since we're mildly oversold, I wouldn't be surprised to see a bit of a short term bounce here. A break above or below these lines would be a game changer (unless we drift sideways at some point). We'll take it a day at a time. For now, my systems are still at (-1-1-1) = -3, a strong sell signal.

BTW, TSLA lost another 4.2% today. It also looks like AAPL may be trying to form a base around 92, which is a strong support area. Note the very oversold RSI level.

aapl.png
 
Mr Tran:


TRAN.png

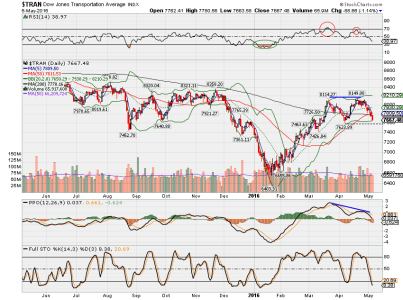
Although the Dow & S&P were basically flat today, the market leader, Mr Tran, is looking very tired, and sagged lower today. A couple of things to note:

1) The oversold RSI in January (circled in green) was a clue that an upturn was about to take place < note to self: pay attention to these signals! >
2) After the nice run up to mid March, we got an overbought RSI warning (circled in red).
3) After a little pull-back, Mr Tran attempted to go even higher, but ran out of steam. Notice the divergence between the higher price highs and the lower PPO highs, which was a warning sign. Also note that the RSI got near the 70 warning line again, so look out below!
4) So now we're getting a pretty steep sell-off, and it blew right through the 50 DMA. I'd watch the level near 7624 (dashed black line) as a possible support area. If that fails, look for a possible 50% Fib retracement near 7277.

And just for the fun of it, let's take a look at how TSLA is doing:

tsla.png

Now THAT'S what I call a steep drop off a cliff! (Tell me again who was saying to buy this stock a few days ago???)

BTW, the 50% retracement level is around 205 (not very far away), but the heavy downward momentum may take it to the 61.8% level, which is around 190.
 
Busy weekend, and busy week ahead. Here's a quick look at the weekly view of the S&P:


SPX Weekly.png

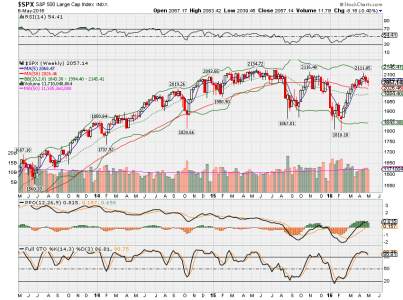
If you look at this chart like the path of a roller coaster, you can see the big rounding top from 2013-2015, followed by the Aug 2015 multi-week stomach wrenching downturn, then another slow climb higher, and another steep drop-off in January of this year.

If you had to guess what's gonna happen next on your roller coaster ride, (looking at the last couple of weeks), what do you think might happen? Think you're gonna go higher, or lower?

Wheeeee!!!
 
Hello Mr. John Ross. I like your chart. Looks like it will go down.
If I could only rely on ONE indicator per chart, I easily would choose to rely on the Full Stochastic (or even Slow Stochastic) on a WEEKLY chart as indicator for direction; while I think the MACD is best indicator on the DAILY charts. But of course I always look at Bollinger Bands, price, band slopes; and also the daily EMAs (10,20,50,100) and their slopes as well .... plus now look to PVO on SPX and Tran. Also, like to hear Chris Ciovacco weekly take on the tons of comparisons he makes of sectors, equities to bonds, defensive/discretionary stocks to non-discretionary, etc.

Thank you for the chart posts!!! Best wishes to you! :smile:

Thanks DBA, I like it when you talk tech to me. (Hahaha). I like Ciovacco's analysis, but sometimes his voice puts me to sleep!
 
Back
Top