-
The Forum works well on MOBILE devices without an app: Just go to: https://forum.tsptalk.com
-
Please read our AutoTracker policy on the IFT deadline and remaining active. Thanks!
-
$ - Premium Service Content (Info) | AutoTracker Monthly Winners | Is Gmail et al, Blocking Our emails?
Find us on: Facebook & X | Posting Copyrighted Material
-
Join the TSP Talk AutoTracker: How to Get Started | Login | Main AutoTracker Page
You are using an out of date browser. It may not display this or other websites correctly.
You should upgrade or use an alternative browser.
You should upgrade or use an alternative browser.
MrJohnRoss' Account Talk
- Thread starter MrJohnRoss
- Start date
MrJohnRoss
Market Veteran
- Reaction score
- 58
Here's a look at a 60 minute chart of the S&P from the mid Feb low through today.
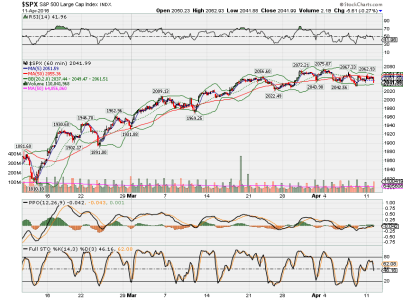
Prices really shot up in the beginning, but take a look at that trajectory now. Flattening out and beginning to fall, with lower highs and lower lows since the beginning of the month. Perhaps this Fed induced, corporate buyback, short squeeze rally is running it's course. Perhaps.

Prices really shot up in the beginning, but take a look at that trajectory now. Flattening out and beginning to fall, with lower highs and lower lows since the beginning of the month. Perhaps this Fed induced, corporate buyback, short squeeze rally is running it's course. Perhaps.
MrJohnRoss
Market Veteran
- Reaction score
- 58
A quick look at USO:
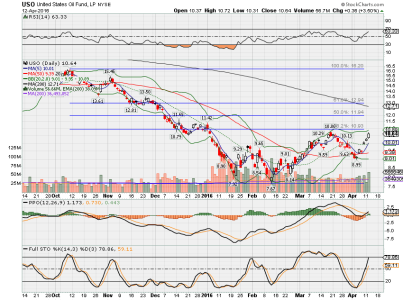
The rally in oil prices sure helped stocks today. (Strange, sometimes it helps, and sometimes it doesn't. Didn't seem to help yesterday, did it?)
In any event, momentum is strong, and it's looking like USO may break through previous resistance at the 38% Fib ratio around 10.93. If it fails, like it did last time, we'd have a double top, which wouldn't be a good sign. So it will be interesting to see what happens over the next few days. My guess is a possible breakout, but it may be a fakeout, and we head back down to test those lows again.
The falling dollar sure seems to be helping commodities, but the dollar index (UUP) is looking very oversold, with it's RSI at 29, so it's due for a bounce soon, which could cause commodities, including oil, to fall.
MrJohnRoss
Market Veteran
- Reaction score
- 58
Chart of $TNX - 10 Year US Treasury Yield Index:
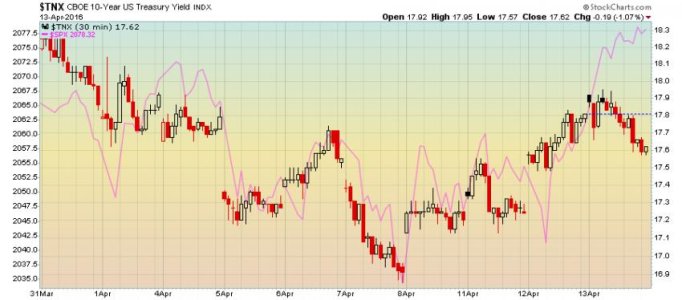
Yields fell today, and yet the market rose higher. Hmmm... This is one of those cases when stocks and bonds become "de-coupled". Take a look at the chart. The candlesticks represent 30 minute bars of the 10 Year Yield, and the pink line in the background represents the S&P 500. Generally speaking, when the market falls, yields fall. When the market rises, yields rise. This is logical, because stocks and bonds compete for money. If stocks are rising, who wants to buy bonds? No one, unless they're gonna pay me more, hence the rise in yields to entice investor's money.
So it's unusual to see the market climb higher, and bond yields fall further. Something's fishy here. Either stocks need to fall, or bond yields need to rise, or both. So which one is right?
My guess is the bond market trumps stocks. Notice what happened yesterday - stocks fell hard early, and yet yields rose higher. What happened later in the day? Yields continued to rise, and stocks made a U-turn, and rose higher also. Not saying this works every time, but it's certainly a strong clue.
Meanwhile, two of my systems triggered buy signals today, and the other may not be far behind. (+1+1-1) = +1, a mild buy signal. At this point, today's breakout was certainly a CoC day, in Wycoff terms.
And more air under the wings to lift the oil prices...........talk of oil supply being lower than in the past.
Oil Gains Before Doha Talks as IEA Sees Global Market Balancing - Bloomberg
Oil Gains Before Doha Talks as IEA Sees Global Market Balancing - Bloomberg
MrJohnRoss
Market Veteran
- Reaction score
- 58
And more air under the wings to lift the oil prices...........talk of oil supply being lower than in the past.
Oil Gains Before Doha Talks as IEA Sees Global Market Balancing - Bloomberg
Those Iraqis may have something to say about that.
MrJohnRoss
Market Veteran
- Reaction score
- 58
Mr Tran is looking up:
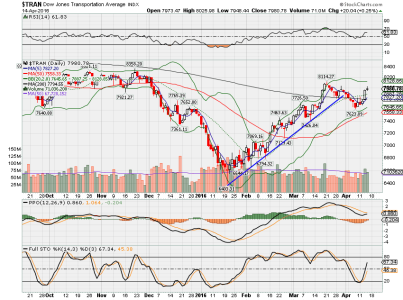
Yesterday was a big day for TRAN. Not surprised to see it pause here. There's plenty of room to run higher, as we don't have overbought readings yet. Well within the BB, RSI looks fine, and PPO is not overbought. Yesterday's gap higher by the S&P sure took me by surprise. It also looks like USO is deciding whether it's going to go any higher. That and the USD may be the keys to where we go from here. UUP is starting to bounce from oversold conditions. Stronger dollar may hurt oil, which may hurt stocks. My timing systems remain at +1, mildly bullish.

Yesterday was a big day for TRAN. Not surprised to see it pause here. There's plenty of room to run higher, as we don't have overbought readings yet. Well within the BB, RSI looks fine, and PPO is not overbought. Yesterday's gap higher by the S&P sure took me by surprise. It also looks like USO is deciding whether it's going to go any higher. That and the USD may be the keys to where we go from here. UUP is starting to bounce from oversold conditions. Stronger dollar may hurt oil, which may hurt stocks. My timing systems remain at +1, mildly bullish.
MrJohnRoss
Market Veteran
- Reaction score
- 58
Buckle your seatbelts, USO may get slammed tomorrow, as Iran's "No Deal" is rattling the oil markets.
Between that and the Saudi's threatening to dump all their U.S. assets, uncertainty may rule the day tomorrow.
Between that and the Saudi's threatening to dump all their U.S. assets, uncertainty may rule the day tomorrow.
MrJohnRoss
Market Veteran
- Reaction score
- 58
Buckle your seatbelts, USO may get slammed tomorrow, as Iran's "No Deal" is rattling the oil markets.
Between that and the Saudi's threatening to dump all their U.S. assets, uncertainty may rule the day tomorrow.
These are some strange times. Oil rallied along with the markets all day. Go figure. My guess is tomorrow will be a down day. S&P is outside the upper BB both on the daily and hourly charts, and RSI is over 70 on the hourly. Expecting a cool off, which seems logical, but apparently logic has been thrown out the window these days. Volume has been weak, so this mini rally is suspect. No change in my system readings, but we're very close to a strong buy +3 if tomorrow closes strongly higher.
MrJohnRoss
Market Veteran
- Reaction score
- 58
Temptation is tapping on my shoulder, saying: "pssst, you're missing out on all these gains - c'mon, put your money in stocks now!" That's the way temptation works.
I prefer to use a proper set up. This is not the proper set up:
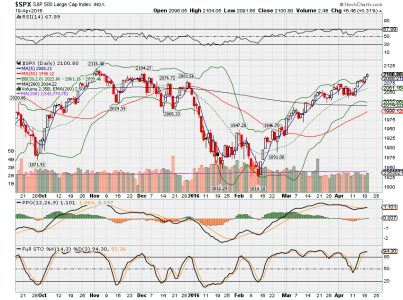
Even though all three of my systems are now in "buy" mode, this market is quite overbought, and is due a pullback, IMHO. RSI is near 70, PPO is overbought, and prices are above the upper BB. Maybe the "sell in May and go away" phenomenon will throw some cold water on this market. Pretty much nothing else has cooled it off. Even the fundamentals - extreme P/E ratio's etc., seem to have no effect.
Is this the final "bubble" that the Fed is creating during this election year? Damn the torpedo's, full speed ahead?
I prefer to use a proper set up. This is not the proper set up:

Even though all three of my systems are now in "buy" mode, this market is quite overbought, and is due a pullback, IMHO. RSI is near 70, PPO is overbought, and prices are above the upper BB. Maybe the "sell in May and go away" phenomenon will throw some cold water on this market. Pretty much nothing else has cooled it off. Even the fundamentals - extreme P/E ratio's etc., seem to have no effect.
Is this the final "bubble" that the Fed is creating during this election year? Damn the torpedo's, full speed ahead?
MrJohnRoss
Market Veteran
- Reaction score
- 58
RealMoneyIssues
TSP Legend
- Reaction score
- 101
Even though all three of my systems are now in "buy" mode, this market is quite overbought, and is due a pullback, IMHO. RSI is near 70, PPO is overbought, and prices are above the upper BB. Maybe the "sell in May and go away" phenomenon will throw some cold water on this market. Pretty much nothing else has cooled it off. Even the fundamentals - extreme P/E ratio's etc., seem to have no effect.
Is this the final "bubble" that the Fed is creating during this election year? Damn the torpedo's, full speed ahead?
What else are banks supposed to do with all this free electronic money... buy stocks
MrJohnRoss
Market Veteran
- Reaction score
- 58
MrJohnRoss
Market Veteran
- Reaction score
- 58
What else are banks supposed to do with all this free electronic money... buy stocks
True dat.
MrJohnRoss
Market Veteran
- Reaction score
- 58
AGG (F Fund) had a large bearish engulfing candle today.
View attachment 37987
As I stated on 4/7: "Looking at the chart, perhaps AGG is getting a bit too hot, as the RSI is now over 75. Wouldn't be surprised to see a cool down in the next few days, just to unwind the overbought condition. The same thing happened back in Feb, when the RSI got too high, AGG went sideways for a few weeks."
As it turned out, that was the high for AGG as of this writing. Down 24 ticks today, which is pretty good sized for the bond fund.
S&P looked pretty good all day... except for that final hour, when the rug got pulled out from underneath it. That created a spinning top formation on the daily chart, which indicates indecision and a possible short term reversal.
Cactus
TSP Pro
- Reaction score
- 38
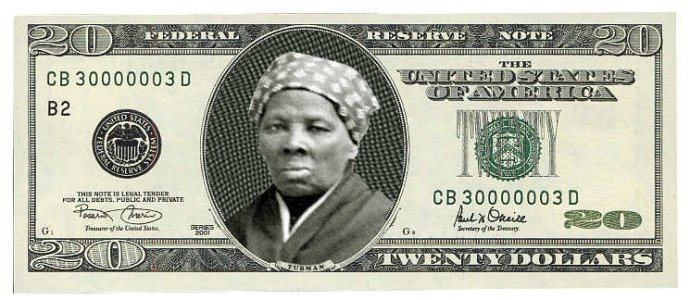
My wife works as a cashier and what bugs her is that they don't pull the old stuff out of circulation when they introduce a new design. There have been so many new designs lately that you get 4 or 5 in circulation at the same time. You get the new big picture one, old small picture one, old green one, new yellow one, and all the holographic new seal and security strip ones. That doesn't include all the kids hitting their dad's collection for the really old stuff like silver certificates.The new 20 spot. Get used to it.
View attachment 37986
Lately there have been counterfit $10s going around and the counterfiters have figured out how to get them to pass the brown pen check.
MrJohnRoss
Market Veteran
- Reaction score
- 58
My wife works as a cashier and what bugs her is that they don't pull the old stuff out of circulation when they introduce a new design. There have been so many new designs lately that you get 4 or 5 in circulation at the same time. You get the new big picture one, old small picture one, old green one, new yellow one, and all the holographic new seal and security strip ones. That doesn't include all the kids hitting their dad's collection for the really old stuff like silver certificates.
Lately there have been counterfit $10s going around and the counterfiters have figured out how to get them to pass the brown pen check.
Yup, I hear ya, but it would be pretty difficult to round up every $20 bill that wasn't current and get them all out of circulation.
MrJohnRoss
Market Veteran
- Reaction score
- 58
A look at oil (USO):
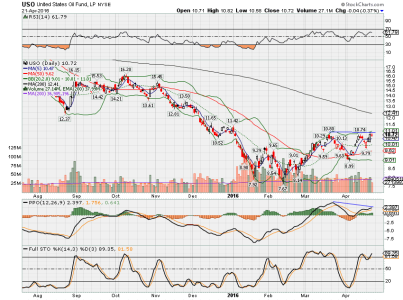
Looks to me like USO may be making a double top. We can never count on anything 100%, but there is a divergence between the two highs in the 10.80 range, and the PPO indicator, which is quite a bit lower during this second peak (down sloping blue line). A fair counter argument is that the RSI is roughly the same for both peaks. Fair enough.
Fundamentally speaking, there is more oil being pumped out of the ground than there is usage, so prices SHOULD be going lower. But it doesn't matter what I think, or what the fundamentals are. Prices are going to go where they must go, so watch your charts carefully. We should find out in short order if this turns out to be a double top, or just a pause on the way higher.
Similar threads
- Replies
- 0
- Views
- 85
- Replies
- 0
- Views
- 152
- Replies
- 0
- Views
- 166

