-
The Forum works well on MOBILE devices without an app: Just go to: https://forum.tsptalk.com
-
Please read our AutoTracker policy on the IFT deadline and remaining active. Thanks!
-
$ - Premium Service Content (Info) | AutoTracker Monthly Winners | Is Gmail et al, Blocking Our emails?
Find us on: Facebook & X | Posting Copyrighted Material
-
Join the TSP Talk AutoTracker: How to Get Started | Login | Main AutoTracker Page
You are using an out of date browser. It may not display this or other websites correctly.
You should upgrade or use an alternative browser.
You should upgrade or use an alternative browser.
MrJohnRoss' Account Talk
- Thread starter MrJohnRoss
- Start date
MrJohnRoss
Market Veteran
- Reaction score
- 58
1950 was finally taken out with conviction. What was once resistance, now becomes support. I'm guessing that new resistance will be in the 2000 - 2025 area, where there was previous support. It also will match up closely with the falling 200 DMA.
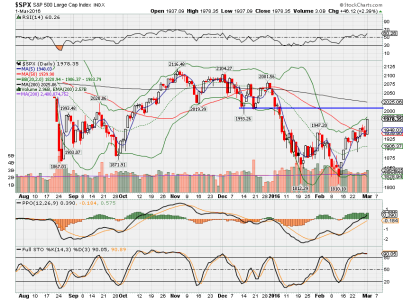
VIX timing system has been oscillating between buy and sell for the last few days, and may be embedded. PMO system still is on a mild sell signal. Overall, we are (+1-1+1) = +1, which is a mild buy signal. With today's strong candle, I'd expect a short term pullback, but intermediate term, it's looking more and more likely that momentum will carry us higher. Now the only question is... should I burn an IFT to get in at this stage? RSI is only at 60, but we're at the upper BB, so I will likely hold off for now. I'm also seeing a possible bear flag on the 1 hr chart.
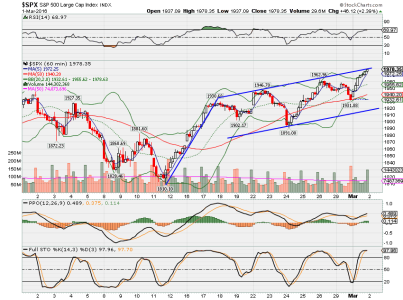

VIX timing system has been oscillating between buy and sell for the last few days, and may be embedded. PMO system still is on a mild sell signal. Overall, we are (+1-1+1) = +1, which is a mild buy signal. With today's strong candle, I'd expect a short term pullback, but intermediate term, it's looking more and more likely that momentum will carry us higher. Now the only question is... should I burn an IFT to get in at this stage? RSI is only at 60, but we're at the upper BB, so I will likely hold off for now. I'm also seeing a possible bear flag on the 1 hr chart.

MrJohnRoss
Market Veteran
- Reaction score
- 58
MrJohnRoss
Market Veteran
- Reaction score
- 58
1950 was finally taken out with conviction. What was once resistance, now becomes support. I'm guessing that new resistance will be in the 2000 - 2025 area, where there was previous support. It also will match up closely with the falling 200 DMA.
VIX timing system has been oscillating between buy and sell for the last few days, and may be embedded. PMO system still is on a mild sell signal. Overall, we are (+1-1+1) = +1, which is a mild buy signal. With today's strong candle, I'd expect a short term pullback, but intermediate term, it's looking more and more likely that momentum will carry us higher. Now the only question is... should I burn an IFT to get in at this stage? RSI is only at 60, but we're at the upper BB, so I will likely hold off for now. I'm also seeing a possible bear flag on the 1 hr chart.
Up 41 ticks today on the S&P after a wish-washy day. Are we near a top? Ian Thijm seems to think it's either today or tomorrow, then a sharp drop. We shall see. Either way, if we run up to the resistance area (S&P 2020 area), we're just shy of 2% from a possible top. Once again, the risk/reward ratio is just not appealing enough for me at this time. I'll wait for a better entry point, which would occur AFTER a swing low.
It's currently hard to try to time the entry in the TSP. I bought in when we were testing 1890 and by the end of the day we closed 40 S&P points higher at 1930. I'm with you and expect a pull back but think I'll just ride it down because I think any pull back will be short lived.
I am following the same support-resistance transitions. However, I am also looking at the trending channel. The lows since the recent bottom low of 1810 on 11 Feb (1891 on 24 Feb, 1931 on 29 Feb) form a trend line that will have to be tested before the 'big turn to the downside' occurs.
Volume is weakening, and I would feel better with a flag formation instead of a slightly meandering movement in the area of 1980.
Volume is weakening, and I would feel better with a flag formation instead of a slightly meandering movement in the area of 1980.
MrJohnRoss
Market Veteran
- Reaction score
- 58
Hey JR, what do you think on gold's current run? Continue or peter out? I bought some GLD today
PM's look to me like they're short term overbought, but this breakout looks like it could be the "real deal". Hope you make a bundle, Sniper.
MrJohnRoss
Market Veteran
- Reaction score
- 58
Updated chart and analysis of the S&P:
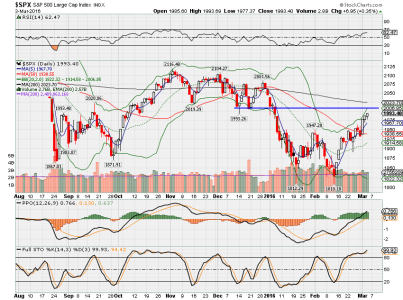
Nearing possible resistance at the 2020 area. Candles climbing the upper BB, which is pretty impressive momentum, not to mention that rocketing PPO. RSI is only at 62, so we may have more road to run. However, look at that Stoch reading... it was already overbought - now it flashed even higher, up to 99.93!
The similarities to the October 2015 rally are uncanny, IMHO. That Oct rally started Sept 30, and lasted until Nov 3, just over one month (25 trading days), for a 12% gain. The current rally started Feb 12, so if this rally lasts as long as the last one, it would top out on or about Mar 18. A similar 12% gain would put our top around 2048, just above our resistance zone. We shall see.
We're still short term overbought, so anything can happen. I'll take it one day at a time, and see how this market plays itself out. If I was already long C or S, I'd hold, but not going to jump in at this point. FWIW, all three of my systems have pivoted to buy signals (+3). Mr VIX is collapsing - all the way down to the 16.70 area. I think he's saying "come on in, the water's fine"! (Pay no attention to the sharks).
MrJohnRoss
Market Veteran
- Reaction score
- 58
Updated chart of the S&P:
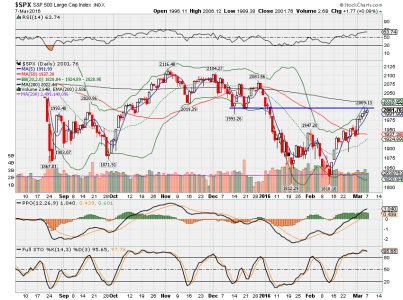
So far, the resistance line in the 2000 - 2020 area is holding. Momentum still looks strong, RSI is not overbought, and we're not outside the upper BB. That being said, markets don't go up forever. Just noticed that we've had five consecutive trading days higher - that's pretty rare, and hasn't happened since last Sept/Oct. Also, the Nasdaq is looking rather toppy, with a doji on Friday, and hollow spinning top lower today, which does not bode well for future market gains. This will be an interesting test of the resistance area.
My guess is we may see a few days of "consolidation" until the market decides which way the forces are going to pull it - up or down. Oil has had a nice rally, which has levitated the markets, but it may be time for oil to rest. The USD has been weakening, which has given commodities a nice boost.
The massive global debt problems are not going away, so I'm not getting too bullish on this countertrend rally. My three system reading is (+1+1-1) = +1, which is now reduced to a mild buy signal.
MrJohnRoss
Market Veteran
- Reaction score
- 58
With the S&P down 22.50 points today, it sure looks like the short squeeze may be ending. Price closed near the LOD, which is not a good sign. PPO, Stoch, and RSI all turned lower today. Is this the end of the rally? IDK, but it sure backed off that resistance line with a vengeance. It may be time to consider moving to the F Fund if the market continues lower over the next day or two. My three system reading remains (+1+1-1) = +1, a mild buy signal.
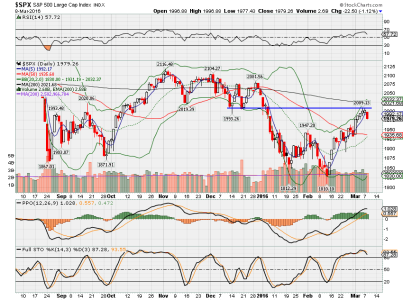
IFT to the F Fund as of COB 3/10/16. Markets look like they are beginning to roll over. Dollar is getting crushed. Even bonds are down today, which is unusual.
MrJohnRoss
Market Veteran
- Reaction score
- 58
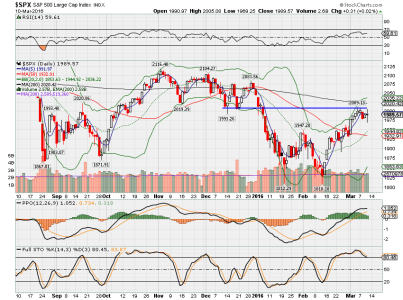
When I pulled the trigger this morning to enter the F Fund, the market was down hard. Was surprised to see it climb back up near the zero line. This market sure looks like it's wanting to roll over, but it's not in any hurry to do so. Been looking at the Transports and Nasdaq, which are the market leaders. Both appear to be heading lower, at least by looking at their respective Stoch, RSI and 5DMA readings. There's always the possibility that we go into a trading range for a while, until there is a catalyst that takes the market one way or the other. Resistance line is holding firm. My three system reading remains (+1+1-1) = +1, a mild buy signal.

MrJohnRoss
Market Veteran
- Reaction score
- 58
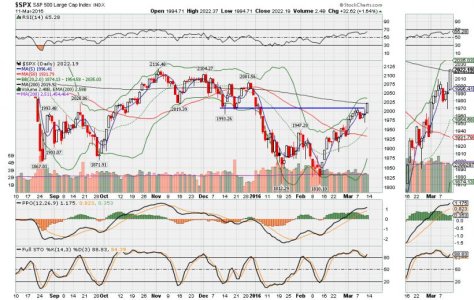
Another big candle higher for the market, which broke through the resistance line, but not completely out of the 2000-2020 area. It could be a head fake rally to sucker dumb money in. It could also be yet another stepping stone on it's way higher. I'm leaning towards the bearish camp when reviewing the longer term (weekly) charts and indicators. Short term overbought, but the rally continues, regardless.
I think the market has been climbing up the back of higher oil prices, and not so sure oil is going to go a lot higher. The storage tanks are nearly full, and the Iranians want to ramp up production big time. Don't know where all this oil is supposed to be stored, but I'm thinking we're going to get to a point where there just isn't anywhere else to put it, and oil prices will dump hard. That will likely take the market with it. We're also going into the seasonal refinery maintenance period, which means oil won't be going to refineries as much, meaning even higher storage levels. Sure will be interesting to see what happens tomorrow and the rest of this week.
I think the market has been climbing up the back of higher oil prices, and not so sure oil is going to go a lot higher. The storage tanks are nearly full, and the Iranians want to ramp up production big time. Don't know where all this oil is supposed to be stored, but I'm thinking we're going to get to a point where there just isn't anywhere else to put it, and oil prices will dump hard. That will likely take the market with it. We're also going into the seasonal refinery maintenance period, which means oil won't be going to refineries as much, meaning even higher storage levels. Sure will be interesting to see what happens tomorrow and the rest of this week.

MrJohnRoss
Market Veteran
- Reaction score
- 58
Chart of USO:
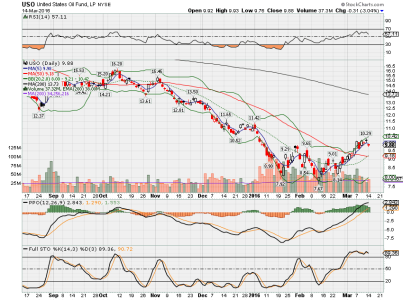
The price of oil has had a nice run up, but perhaps it's time for oil bulls to come to grips with reality. Today was the first time in about a month that USO looks like it might be rolling over and possibly heading lower. I'd watch for a possible PPO crossover to confirm, but fundamentals just don't jive with the run up, IMHO. If it heads lower, it may take the market with it. The easy money has been made in stocks for the past month. Now it looks like it may be getting dicey. Maybe the Feds will announce that they want to keep the party rolling just a little bit longer...

The price of oil has had a nice run up, but perhaps it's time for oil bulls to come to grips with reality. Today was the first time in about a month that USO looks like it might be rolling over and possibly heading lower. I'd watch for a possible PPO crossover to confirm, but fundamentals just don't jive with the run up, IMHO. If it heads lower, it may take the market with it. The easy money has been made in stocks for the past month. Now it looks like it may be getting dicey. Maybe the Feds will announce that they want to keep the party rolling just a little bit longer...
MrJohnRoss
Market Veteran
- Reaction score
- 58
Chart of the Dow Jones Transportation Index:
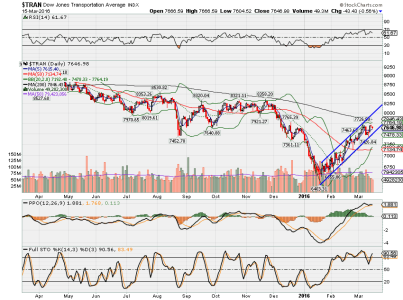
The Transports tend to lead the market, so it's a good idea to keep an eye on what's going on technically. The death cross occurred last May, and it's been downhill since then, except for this nice run up from the January lows. Tran has gained over 20% from the January bottom to it's March 4 high, and has traded pretty well within the parallel channel (in blue). The RSI pegged out at just about 70 on March 7, and prices have cooled off since then. The other thing I notice is that the PPO has been weakening lately. The histogram is almost at zero now, and looks like it's just a matter of time before it crosses below. Prices are still 200 points below the 200 DMA, which has been acting as resistance for the S&P. (The Nasdaq is also well below it's 200 DMA).
Technically, the Transports are looking a little weak here after a heck of a run-up. I'd be surprised to see it or the S&P move much higher. IMHO, barring some unforeseen event, the odds are looking more an more likely that we're nearing a short term top in the market.
MrJohnRoss
Market Veteran
- Reaction score
- 58
A closer look at the Trannies:
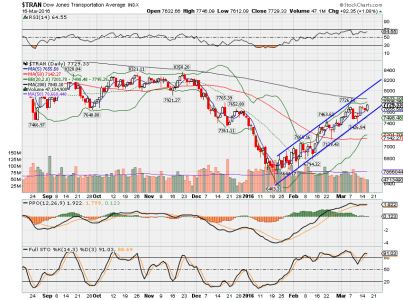
The Fed provided enough juice to give the market a nice pop today, and kept the PPO from a bearish crossover. The big decline in the dollar sent commodities higher, including oil, which helped push stocks higher as well. Interestingly, the bond market de-coupled from the norm, and went higher (rates went lower). This has happened several times lately, and usually rectifies itself pretty quickly (either stocks go lower or rates go higher).
Seems like I keep saying we're overbought and yet the market keeps going higher and higher. Call it a short squeeze, or corporate buy backs, or whatever you want, but the market isn't going to climb the rising channel forever. I really don't think we're in a wonderful economic environment, in fact far from it. This rally has been impressive, but I just don't see it lasting much longer, even though my systems are fully bullish (+1+1+1) = +3.
My comment from a couple of weeks ago may still hold true... "The similarities to the October 2015 rally are uncanny, IMHO. That Oct rally started Sept 30, and lasted until Nov 3, just over one month (25 trading days), for a 12% gain. The current rally started Feb 12, so if this rally lasts as long as the last one, it would top out on or about Mar 18. A similar 12% gain would put our top around 2048, just above our resistance zone."
We shall see how it plays out...
MrJohnRoss
Market Veteran
- Reaction score
- 58
This looks like a blowoff top:
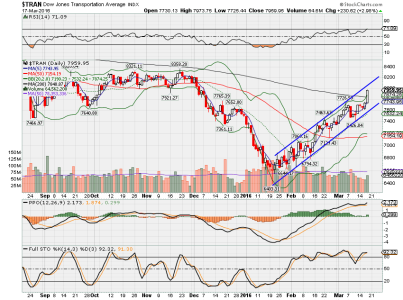
Up almost 3% today on the Trannies. RSI has now gone into the danger zone. Blew right thru the 200 DMA, and well outside the upper BB. If this doesn't call for a pullback, I'm not sure what does. Interestingly, bonds were higher again today. The big gap down for the dollar today sure is pushing commodity (and stock) prices higher. Time for a rebound?

Up almost 3% today on the Trannies. RSI has now gone into the danger zone. Blew right thru the 200 DMA, and well outside the upper BB. If this doesn't call for a pullback, I'm not sure what does. Interestingly, bonds were higher again today. The big gap down for the dollar today sure is pushing commodity (and stock) prices higher. Time for a rebound?
MrJohnRoss
Market Veteran
- Reaction score
- 58
I was wrong yesterday when I said this looked like a blowoff top... THIS looks like a blowoff top:
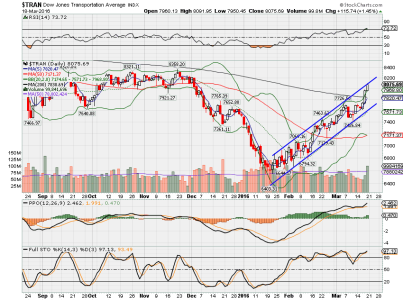
The PPO hasn't been this stretched in over 3 years. Today's candle was almost completely above the upper BB (very rare), and we're bumping up against that upper channel.
Perhaps I got lucky when I called for a top on March 18, and then again, perhaps this market will just act like the energizer bunny and keep going and going and going...
MrJohnRoss
Market Veteran
- Reaction score
- 58
Toppy market? Chart of the % of stocks above their 20 DMA:
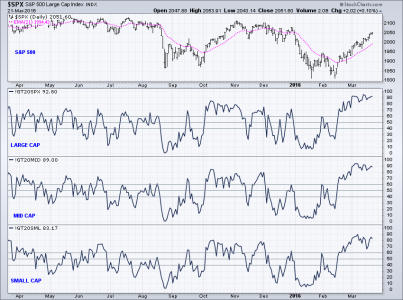
Large cap: 93%
Mid cap: 89%
Small cap: 83%
Other signs of possible toppy market...
Percentage of S&P 500 stocks with
PMO rising: 77%
PMO crossover buy signal: 86%
PMO above zero: 92%
Usually, anything above 80% on the above readings might be considered overbought.
The only thing I'm seeing headed lower, (besides the VIX), is the NYSE McClellan Oscillator (NYMO), after being in very overbought territory. The summation index, however, is still climbing higher.
Just some food for thought on a slow market day.
Similar threads
- Replies
- 0
- Views
- 85
- Replies
- 0
- Views
- 152
- Replies
- 0
- Views
- 166

