MrJohnRoss' Account Talk

Nice big down day to start the year, which seems like an ominous sign of things to come. I really haven't seen much in the charts to be bullish about. I tried to time a Santa rally, only to get my hat handed to me. Volatility has gotten extreme, with wild up and down days.

Here's what I see:
The Dow Theory is still bearish.
Rounded top formations of the Dow, S&P, Trannies.
Small caps are getting crushed during their seasonal strong period.
The Nasdaq seemed to be holding up... until today's rout of the big 4.
The commodities index is near an all time low.
The NYAD and NAAD are looking bad.
THe NYHL and NAHL are looking even worse.
The BDI is within a smidgen of it's all time low.
High yield bonds are caving in,
EEM is rolling back down near all time lows.
WTIC is going lower, lower, lower...

Other than that, everything is hunky dory.

2015 was a year when the G Fund beat all stock funds. My guess is that we're going to continue that vein for a while longer. Oh sure, we'll have some massive up days, where everyone (including myself) will be left wondering if the worst is over. But unless the technicals can first give us some sure footing, and secondly some sustainable higher highs and higher lows, I'm afraid I'll remain in the bearish camp. I may occasionally play a few moves to capitalize on extreme down moves to scalp some points of the relief rally, but my guess is that Mr Market has topped for a while, and we're likely to see lower prices in the months ahead. I hope I'm wrong.

Best of luck in 2016.
 
MrJohnRoss I agree with you I don’t think we are going to see any major upshifts in the market till after November of next year. I’m still buying and holding.
 
Nice big down day to start the year, which seems like an ominous sign of things to come. I really haven't seen much in the charts to be bullish about. I tried to time a Santa rally, only to get my hat handed to me. Volatility has gotten extreme, with wild up and down days.

Here's what I see:
The Dow Theory is still bearish.
Rounded top formations of the Dow, S&P, Trannies.
Small caps are getting crushed during their seasonal strong period.
The Nasdaq seemed to be holding up... until today's rout of the big 4.
The commodities index is near an all time low.
The NYAD and NAAD are looking bad.
THe NYHL and NAHL are looking even worse.
The BDI is within a smidgen of it's all time low.
High yield bonds are caving in,
EEM is rolling back down near all time lows.
WTIC is going lower, lower, lower...

Other than that, everything is hunky dory.

2015 was a year when the G Fund beat all stock funds. My guess is that we're going to continue that vein for a while longer. Oh sure, we'll have some massive up days, where everyone (including myself) will be left wondering if the worst is over. But unless the technicals can first give us some sure footing, and secondly some sustainable higher highs and higher lows, I'm afraid I'll remain in the bearish camp. I may occasionally play a few moves to capitalize on extreme down moves to scalp some points of the relief rally, but my guess is that Mr Market has topped for a while, and we're likely to see lower prices in the months ahead. I hope I'm wrong.

Best of luck in 2016.
Sadly...I must agree with your assessment. Thanks for the great breakdown!! Best wishes to you and to everyone!!!!!!!!! :smile:
 
Not sure if we're going to hit a bottom yet, but the NYMO has a reading of -89, which is about as bearish as it gets. We got over -100 when the August 24 bottom took place, so we may have a little more to go, but we're certainly closer to a bottom than we were a week ago. There really hasn't been any buying strength at all, which has been shown very clearly in the final hours of trading.

Sold my YANG and RUSS yesterday, and now wishing I had kept them a wee bit longer. I shouldn't complain, as there was a very handsome profit from both, but I got spooked by a possible short term bottoming pattern which (obviously) didn't materialize.

I am of the opinion that we may get a bounce soon, but it will be short lived. There is just too much bad mojo in the financial markets worldwide to stop the avalanche that's taking place. Not sure if I'll try to time some rallies, or just sit back and wait for what I feel is a prime opportunity to jump back in, which may take weeks or possibly months to present itself.

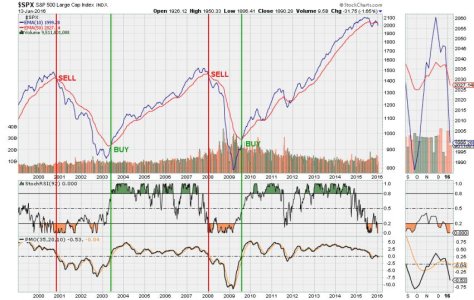
For those who may be interested, here is the long term weekly timing chart for the S&P 500. Once again, we have a bear market sell signal. Perhaps the last signal (in August) was negated by the head and shoulders head fake rally in October that got everyone thinking that there was really nothing to worry about. Unfortunately, the markets could never recapture their old highs, and began slipping quietly lower over the course of the year. It was a sure sign of a very weak market that was ripe for a fall.

It may pay to study some charts of our last few bear markets. I know each one is different, but we can sometimes glean some information from them that may help us in the future. Perhaps some patterns that present themselves to us will look familiar to patterns we've seen in the past.

As the old saying goes... history may not exactly repeat itself, but often times it rhymes.

Good luck!


S&P Long Term Timing.jpg
 
Been a hell of a start to the new year for stocks. One for the history books. Perhaps it's time for a little bounce. Having my doubts that we've seen the last of the selling though.

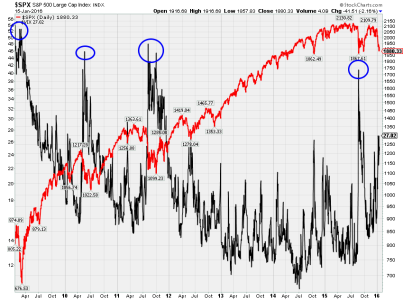
Not sure if anyone has seen where major bottoms in stocks look in comparison to the Mr. VIX, but there are plenty of reports to peruse. In a nutshell, we need to see major capitulation (i.e. fear), to put a bottom in place. That hasn't really happened yet, according to Mr. VIX. See chart below:


SPX vs VIX.png


This is a daily chart of the S&P (in red), and the VIX (in black) going back seven years. Note that when the market made a major bottom in 2009, 2010, 2011, and even last August, Mr. VIX spiked well into the 40's (circled in blue). So how much fear was in the market last Friday when the Dow was down over 500 points at one point during the day?? According to Mr. VIX, not so much, with a reading of "only" 27.02.

Of course, this guarantees absolutely nothing. It doesn't really "feel" like there is panic in the streets... yet. Perhaps we need to see a massive sell-off for several days to get Mr. VIX to spike over 40. Once we see a spike, it may be time to consider going long for a short term counter-trend rally. Just be sure to stay close to the exits. IMHO, this rounded top aging bull is just getting started on a long journey lower.

Good luck!
 
Hello MJR,
Those are some really great charts you posted this week. The 10 EMA crossing under 50 EMA (post 4085) is a very helpful indicator. I take that as a sign of high risk. Of course that can be in play for months leading up to massive market drops.

I had never really studied the VIX in terms of seeing a major bottom (post 4087). Its a new one to put in the arsenal for me. I will definitely keep it in mind.

Thank you posting this information. Really appreciate it!

Best wishes to you and everyone on your investments!!!!!!!!
 
Nice chart and analysis. I agree the VIX is important and yet we are so oversold we may well see a relief rally this week. What I find interesting is the VIX is only up around the Oct 2014 and Sept 2015 level when we bounced back up but if we see another step down in the S&P due to Oil, China and Macro events we could see the lows of August and a rise in the VIX to produce an inverse of Aug and Sept with the S&P and the VIX.

Right now the futures are looking up but we will see what tomorrow brings and so far the stocks I watch still haven't dropped the extra 5% that I think they might.

Thanks again and good luck to all! :smile:
 
Well, that turned out better than expected.

Sold TNA @ 43.89 for a tidy gain of 11.36%.


tna.png

This trade represented almost 95% of my 401k, so it was a gutsy, high risk trade. Glad it didn't backfire on me.
 
Not seeing these short term bounces as anything that I want to participate in yet. Market internals still look extremely weak. So far, these bounces appear to be of the dead cat variety. Perhaps the smart money managers are using these bounces to off-load what they can before they get decimated.

The big spike in oil is a good sign for the markets, but don't know how long it will last, or if it's just an outlier blip in the long term downtrend. Jumping back in at this point seems like a high risk, low reward bet, so I will hold off for now. Perhaps it would be good for a one or two day hold, but again the risk is too high for my personal tastes and limited IFT's.

Good luck!
 
I'm holding off for now as well. Went 50% G, 50% F late in this correction. After the S P broke through the August lows I thought it would fall like a rock. Hoping to get better at this. Sooner rather than later:) Thanks Mr JohnRoss, I'm learning lots from your thread.
 
I got in a little in the C fund yesterday hoping for a little bounce. Still remember the big bounce off the low in October 2014 and hoped to get some back. Unfortunately I agree that we probably won't see the big V up until we resolve OIL, DOLLAR AND China so I expect to get out pretty soon next week.

Big snow has started. Have a great weekend! :smile:
 
Yah. I'm a Noobie here (first post).
I'm familiar with the markets but wanted to be more aggressive with my retirement (I still have a ways to go). So, I decided to join the conversations and get insight from everyone here.
The funny thing about investments and models is that some hold more true than others. However, an individual will find the model that they like best because that is what want to hear. We are all like that.
Right now I'm 50 F 50 C. I'm not a believer in this rally over the last few days. To many potential bad things could happen in the short term.
Best of luck to everyone out there. Some people will be right and others will be wrong. That's the nature of investments!
Kind of deep for a first post. LOL!
 
Taking a risk here, and moving to the C Fund today. I'm thinking we're getting a little bear market rally that may take us up to the 2000 area on the S&P before we encounter resistance. This may be completely wrong, but the technical indicators look promising several days ago. Just didn't follow them at the correct time, and missed out on Friday's nice gain.

Good luck!
 
The worst could be behind us but I expect a bear market at least till November. After the election I think we will see the bulls run. I never pulled out and will ride it through.

Taking a risk here, and moving to the C Fund today. I'm thinking we're getting a little bear market rally that may take us up to the 2000 area on the S&P before we encounter resistance. This may be completely wrong, but the technical indicators look promising several days ago. Just didn't follow them at the correct time, and missed out on Friday's nice gain.

Good luck!
 
Bear market volatility bit me today. Would like to see the S&P at least re-claim the 1912 to 1914 area tomorrow, which are about where the 5 and 20 DMA are. If not, it may be time to bail. "Cut your losses early, let your winners ride."

The F Fund is doing extremely well, perhaps too well, as the RSI on AGG just went over 70. Haven't seen that level since Feb 1 of last year, so perhaps it needs a cool down. On the other hand, if the market downdraft continues, it may not make much difference what the RSI level is, as money will flow out of equities and into bonds, driving interest rates lower still. It doesn't help that Japan has joined Europe to drive interest rates all the way down into negative territory. ZIRP was so yesterday now that we have NIRP.

Meanwhile, the investigation continues into the study of timing systems. One caught my eye last night that uses several variables of the PMO on the S&P. Can't say much more than that, but it looks promising, at least in a back test of 2015 data.

One last note... has anyone seen how far the BDI has fallen since August? Believe it or not, it's down 75%. The global slowdown continues...

Good luck!
 
I don’t understand how anyone could see negative interest rates as a good thing.

Bear market volatility bit me today. Would like to see the S&P at least re-claim the 1912 to 1914 area tomorrow, which are about where the 5 and 20 DMA are. If not, it may be time to bail. "Cut your losses early, let your winners ride."

The F Fund is doing extremely well, perhaps too well, as the RSI on AGG just went over 70. Haven't seen that level since Feb 1 of last year, so perhaps it needs a cool down. On the other hand, if the market downdraft continues, it may not make much difference what the RSI level is, as money will flow out of equities and into bonds, driving interest rates lower still. It doesn't help that Japan has joined Europe to drive interest rates all the way down into negative territory. ZIRP was so yesterday now that we have NIRP.

Meanwhile, the investigation continues into the study of timing systems. One caught my eye last night that uses several variables of the PMO on the S&P. Can't say much more than that, but it looks promising, at least in a back test of 2015 data.

One last note... has anyone seen how far the BDI has fallen since August? Believe it or not, it's down 75%. The global slowdown continues...

Good luck!
 
High pole warning for AGG, which may be a sign that bonds are about to drop and interest rates rise. Still holding the C Fund, though the volatility is wacky - both daily and intraday. Didn't close as high as I would have liked, but at least we were near the HOD instead of the LOD thanks to the strong close. PMO system remains on a green light.
 
Back
Top