MrJohnRoss' Account Talk

It will be interesting to see how the market performs over the next few weeks. In the last 16 years, the long term sell signal has only happened twice before, so it's worth paying attention to. My guess is that the market rallies with a Fed decision to leave rates alone, but then falls because of uncertainty for the next two meetings this year, as the market doesn't like uncertainty.

MJR, was just about to post this... Stockman thinks like you WRT no rate changes, but ultimately results in a huge crash. As opposed to raising rates which results in market decline...

Stockman: Markets in store for huge correction if Fed doesn't raise rates - Yahoo Finance
 
You know...based on what I saw today...total wackiness market behavior...I'd have to say that the big boys had already shorted the market and were going to blame a drop on a Fed interest rate hike...but Janet outsmarted them and they weren't about to let their profits get away when they already had the herd where they wanted them...I'm really starting to feel the manipulation...

FS
 
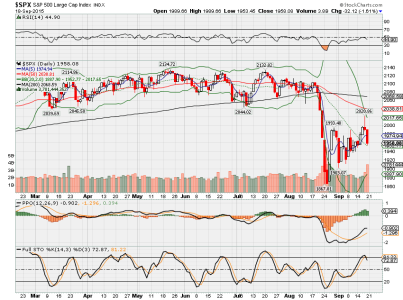
It will be interesting to see how the market performs over the next few weeks. In the last 16 years, the long term sell signal has only happened twice before, so it's worth paying attention to. My guess is that the market rallies with a Fed decision to leave rates alone, but then falls because of uncertainty for the next two meetings this year, as the market doesn't like uncertainty.


S&P Chart.png

Pretty close guess on the markets reaction. Yesterday we had a high pole warning, and now we're back to the bottom of the wedge. This counter-trend rally may have run it's course. Daily momentum is still bullish, but the 60 minute chart shows the market got overheated and needed a breather. Next week will likely dictate which way the longer term trend is going to go. I'm not ready to commit money to the market at this point, as we may need to re-test the lows from 8/24.

Good luck!
 
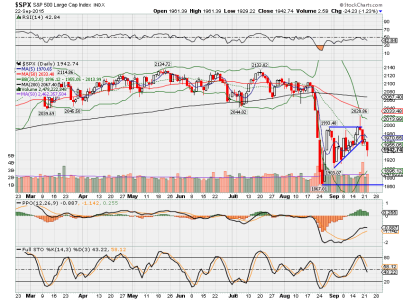
Updated daily chart of the S&P.

S&P Chart.png

Not surprised to see the lower triangular trend line get broken after the "head fake" high pole warning last week. My guess is that the market may soon want to re-test that 8/24 low of the 1867 area. If that area doesn't hold we might even test last October's low in the 1820 area. Several articles I've recently read are calling for a turning point low in early to mid October, a possible rally, and then possibly lower still in November. Hang on to your seatbelts, it could be a bumpy ride.
 
Food for thought. I'm not sure we're in the beginning stages of a bear market or not, but it's worthwhile to know what past bear market patterns looked like.

Anatomy of a Bear Market - What a New Bear Market Could Look Like ~ Robert McHugh

"We believe the stock market has started a massive Bear Market that could last many years. The top arrived for the Industrials in May 2015. Since then, a new Primary Dow Theory Bear Market Signal was generated. Since June 22nd, 2015, the stock market, as measured by the Wilshire 5000, has lost $2.2 trillion. That means over 40 percent of all the QE 1, 2 and 3 money printing programs injected into Wall Street has been wiped out in just a few months. That QE was a raving success, wasn't it? To unload the over $4 trillion of Bonds the Fed is now stuck holding in its balance sheet because of these QE programs, the Fed would have to suck that amount of money from the economy, which would cause an economic depression. The Fed is in trouble. Interest rates are already at zero. Are they going to tighten the money supply after a $2.2 trillion decline in the stock market? If they do, they will be repeating the same inane policy they did at the start of the Great Depression of the 1930s. This market is about to spiral into a black hole and the Fed has been forced out of the game. So, the question is, how will this Bear market look? Will it be a waterfall once and done plunge and V recovery? Probably not..."
 
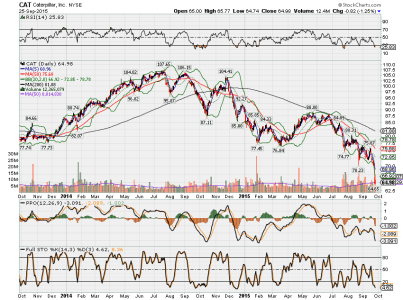
Looking for a "canary in a coal mine" stock that might foretell the future of the economy, and hence, the stock market? It might possibly be CAT (Caterpillar). CAT makes the giant earth moving machines to build major infrastructure all over the globe. If roads, bridges, cities, power plants, etc are going to be built, their machines are going to be there to do the job. So what happens when global building and infrastructure slows down? CAT's machines sit idle, and the company doesn't need to make any new ones, and the stock price suffers. You can clearly see this in the chart below.

cat.png


CAT hit an all time high of 107.65 in July of 2014. Soon after, the stock began to make lower highs and lower lows. Every rally attempt was defeated, and the death cross occurred by November of 2014. A few attempts to get above the 200 DMA failed this year, and we now sit under 65 a share. That's about a 40% decline from the top. If the global economy were to pick up steam, this might be one of the better stocks to keep your eye on for a sustained move higher. My guess is that we've still got a long way to go before we get there.
 
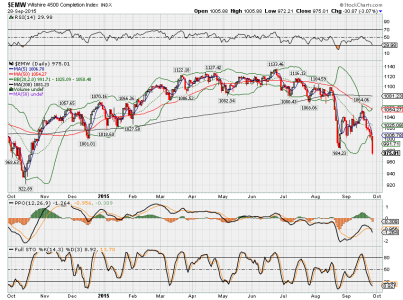
Chart of the S Fund, going off a cliff.


$EMW.png

In other news, the Nasdaq just formed it's death cross today. That completes the "four horsemen" pattern. First the Dow, followed by the S&P, the R2K, and now the Nasdaq. Apparently this is the first time since 2011 that "all four horsemen of the apocalypse" have arrived.

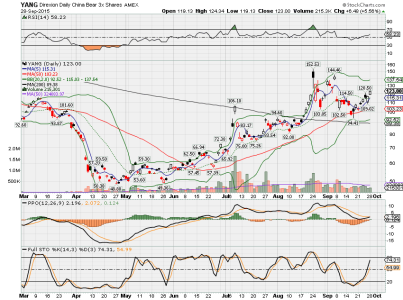
I'm considering a position in YANG. Wanted to buy in this morning, but didn't like the strong gap higher. I'm hoping we get a bit of a market rebound after the -313 point rout of the market today, so I can buy a nice chunk at a slightly lower price. If YANG only makes it to it's 8/24 high of 152.53, it would be a nice little gain of 24% from here. I think there's a possibility that we might even take that old high out at some point in the not too distant future.


YANG.png

Good luck!
 
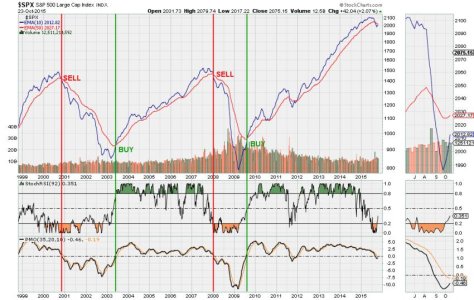
The long term buy/sell signal is still on sell. It's been a hell of a 4 week rally for the S&P. Big caps are trumping small caps by a long margin.


S&P Long Term Timing.jpg


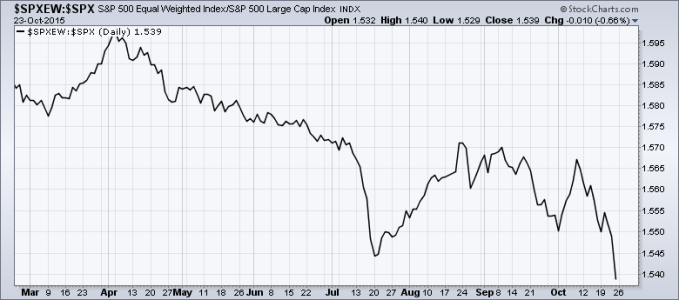
An interesting view of the market is looking at the ratio of the equal weight S&P500 vs the cap weighted S&P500. The SPXEW is severely underperforming SPX, especially during this rally. This tells me that the biggest stocks (MSFT, AMZN, etc.) are pulling the market higher, but the rest of the market is not following along, which could be problematic. The ratio of the SPX vs the RUT looks very similar. For now, enjoy the ride.


spxew vs spx.png
 
JR, just curious, your thoughts about clearing this latest hurdle "the Fed" announcement. Anything standing in the way of progress now? This thing has gone further than most would think possible. My gut says stay out and wait for a good buy-in, but MAN is that hard to do...

Your charts look like SELL to me.

It's been an impressive rally. Personally, I'm going to wait it out for a better entry point. IMHO, we are closer to a short term top than we are to a bottom. It'll be interesting to see if the long term buy/sell signal gets a head fake "buy", only to see the market get whacked in the knees.
 
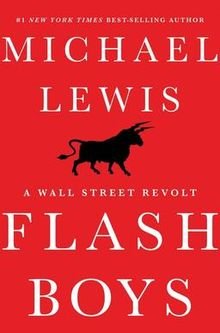
Just finished the book "Flash Boys" last night. It's a great read on how crooked the markets really are. Billions of dollar$$$ are sucked out of the markets every year from the big banks and HFT firms, all at the expense of those of us who think we know what happens when we press the "enter" button on a buy or sell order. I highly recommend you read this one. At least you'll know who's screwing you. Most people have no idea what really goes on, and this book should certainly will help you understand it better.

Flash Boys.jpg
 
It's been an impressive rally. Personally, I'm going to wait it out for a better entry point. IMHO, we are closer to a short term top than we are to a bottom. It'll be interesting to see if the long term buy/sell signal gets a head fake "buy", only to see the market get whacked in the knees.

Overall I agree with you but I think the top is actually more intermediate term (maybe 2 months?)...for now I'll ride this rally as long as we are climbing which I think (hope) has legs through the end of the year. I just redrew my out line at about 2033 (SnP) and will adjust it up as we go up but will bail sooner as necessary. Not that we won't have some decent swings...but I am hoping for the ups to continue. I just wish we could place stops/had more moves/different funds/etc! I would love to be buying energy specific stocks/funds at todays prices using TSP money!
 
Last edited:
It's been an impressive rally. Personally, I'm going to wait it out for a better entry point. IMHO, we are closer to a short term top than we are to a bottom. It'll be interesting to see if the long term buy/sell signal gets a head fake "buy", only to see the market get whacked in the knees.
Hi MJR, It's really hard for me to have faith in the market after that August drop. I'm trying to stick with my read on technicals, but some healthy fear due to what I see in indicators kept me out....until yesterday...still might be premature...will see...i would have liked to watch for better entry but impatience got the best of me yesterday...But indicators were not too bad... Will try to stick with this move into November.
 
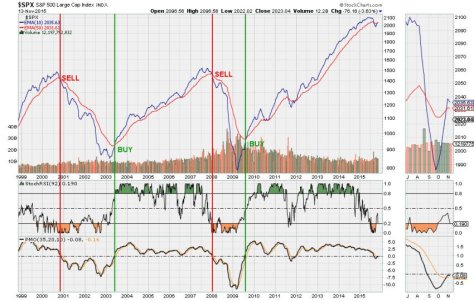
The long term S&P buy/sell signal is still on a sell, but the Oct rally has pushed the short term 10 week EMA sharply higher. It looks like we'll likely have a crossover this week, even if the week finishes down. There may be some whipsaw action taking place, so buckle up and hang on tight.

S&P Long Term Timing.jpg
 
It's been an impressive rally. Personally, I'm going to wait it out for a better entry point. IMHO, we are closer to a short term top than we are to a bottom. It'll be interesting to see if the long term buy/sell signal gets a head fake "buy", only to see the market get whacked in the knees.

The long term S&P buy/sell signal is still on a sell, but the Oct rally has pushed the short term 10 week EMA sharply higher. It looks like we'll likely have a crossover this week, even if the week finishes down. There may be some whipsaw action taking place, so buckle up and hang on tight.

S&P Long Term Timing.jpg


Like I said... Those indicators are turning back down now. Been wondering about the above long term buy sell signal, and if this could be the rare occurrence in it's 16 year history where it didn't work out. It's still possible that we have a failed sell signal, but the market sure looks like it's giving up on last month's rally.

I waited too long to get back into equities, and decided to hold on to the relative "safety" of bonds. Wow, did they get whacked because of the Fed fears! I'm thinking that bonds may have gotten a bit oversold, and with the market going over a cliff, bonds could stage a pretty nice comeback.

As for stocks, we may see some oversold rallies in the next week or so, but my guess is that we continue down from here, and possibly retrace at least 50% of Octobers gains, which would put us in the S&P range of 1994ish before a decent bounce. I just don't see the market going gangbusters higher for any good reason, so intermediate term, I think the markets might chop lower until there are more positive catalysts to move it higher.

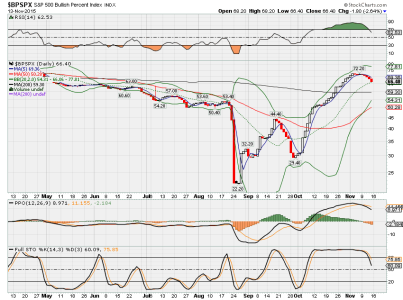
It's been interesting to see so many indicators roll over with the market this last week. An interesting one has been the BPSPX. It peaked just prior to the market, and began rolling over quite nicely to forewarn those of us who watch it. Just another arrow in the quiver, there is no magic bullet.

BPSPX.png

Good luck!
 
Seasonality and a persistent upward bias despite the choppiness has influenced me to move to small caps.

100% S as of COB 11/25/15.

Good luck!
 
Have a Merry Christmas and a Happy Holiday.
I'm hoping for a Santa rally next week but oil and energy sure aren't helping.
:smile:
 
Back
Top