MrJohnRoss
Market Veteran
- Reaction score
- 58
Monthly chart of the S&P 500:
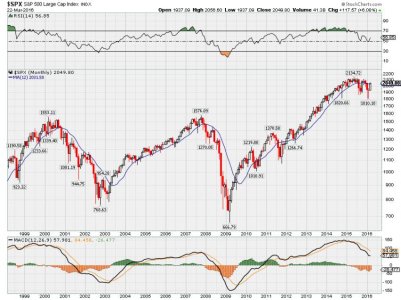
Every once in a while it's a good idea to step back and look at the big picture. It's been a pretty good month so far, with the S&P up 6.08% so far this month. I'm still concerned about the rounded top formation. A couple of other things concern me when looking at this chart:
1) Since 1998, whenever the monthly RSI got into overbought territory, it resolved itself by heading down into oversold territory. This takes a year or two to resolve itself, but it's the nature of the beast. Looks like the RSI started declining out of overbought territory in early 2015, so we're about a year into that time frame.
2) The 12 month moving average - when it rolls over after a long climb like it did in late 2000, and early 2008, it spelled trouble for the market for many months. The 12 MMA peaked last July, and is just beginning what appears to be a rollover process.
3) The MACD has produced a long term sell crossover signal in March of last year. Those crossover signals appear to be pretty accurate forecasts of arriving bear markets. Also note that the MACD reached a historic high in late 2014 before rolling over in 2015, which may mean that the market might need to fall even further than the last two times.
Of course, there's always the question... "could it be different this time?"
Sure, there is always that possibility, but I'd have to say that the odds are stacked pretty high against you.

