JTH's Account Talk

Good morning


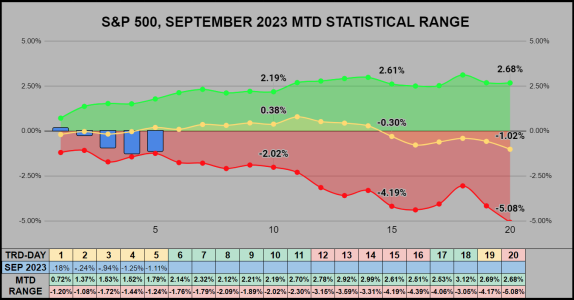
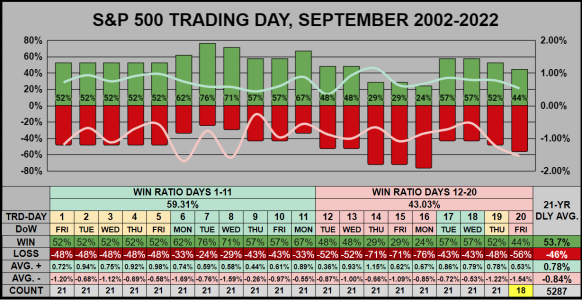
From the past 21-Years, September tends to start the 1st 5 days flat. Perhaps there's a Labor Day holiday effect where students are back in school, vacations have ended, and maybe hedge fund managers start looking for ways to take off risk.


Overall, the first 11 trading days have a statistically higher win ratio, with the last 9 trading days dropping off. Over the past 21 years, September has averaged -1.02% which is the worst 21-year monthly average of all 12 months.
20230831-TRD.png


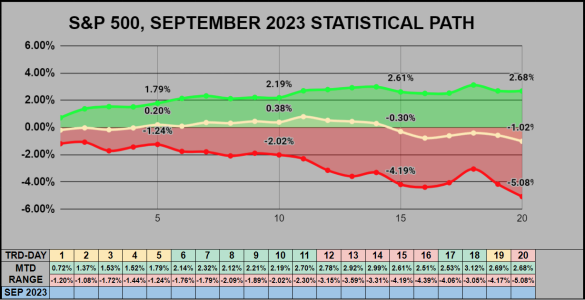
This 2nd chart, is an inbred concoction of compounded statistics. This is the path I'm guessing September can navigate and close in.
20230831-TRD1.png
 
I like the commentary just in case I have no idea what I'm lookin at....... :fing02:

Good morning

From the past 21-Years, September tends to start the 1st 5 days flat. Perhaps there's a Labor Day holiday effect where students are back in school, vacations have ended, and maybe hedge fund managers start looking for ways to take off risk.

Overall, the first 11 trading days have a statistically higher win ratio, with the last 9 trading days dropping off. Over the past 21 years, September has averaged -1.02% which is the worst 21-year monthly average of all 12 months.
 
I like the commentary just in case I have no idea what I'm lookin at....... :fing02:

Yea I know what you mean, I just went through and deleted some older spreadsheets, and I swear, sometimes I have no idea what I created or for what purpose. :D
 
Good morning


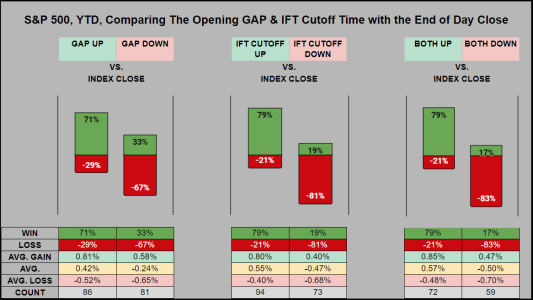
Long story short, trade the direction you see. This chart consolidates two themes which have a similar outcome, the opening gap & the index’s price at the 12-Noon IFT Cutoff time.

FOR SELLERS: Of the past 167 days, when the index gapped positive at the open, the win ratio was 71%. When the 12:00 IFT Cutoff was positive, the win ratio was 79%, when both were positive the win ratio was 79%

FOR BUYERS: Of the past 167 days, when the index gapped negative at the open, the loss ratio was 67%. When the 12:00 IFT Cutoff was negative, the loss ratio was 81%, when both were negative the loss ratio was 83%

20230901-IFT-STAT.png

Lastly, here's the latest blog covering the new Month. STATS FOR SEP


From the past 21-Years, September tends to start the 1st 5 days flat.

Good morning

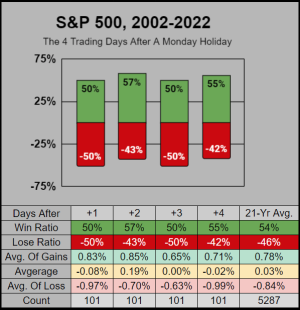
I was curious what the 21-year performance was for the 4 trading days, after Holidays which fell on a Monday. All 4 days are within +/- 4% of the 21-year 54% win ratio, so there's nothing impressive to see here.

20230904-MON-HOL.PNG

 
Last edited:
Good morning

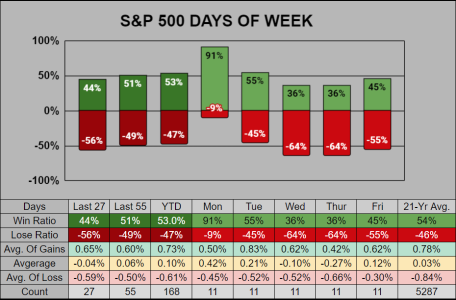
We have our 9th consecutive positive Monday, giving us a 91% win ratio. From the previous 21 years, this has happened 3 times with a 9, 10, & 11th Monday in a row.
-Interestingly, for all 991 Mondays spanning across each of the 4-Quarters & each of the 12-Months, the 69 Mondays in September have the worst win ratio at 42% -Meanwhile, Wed/Thur are tied with a 36% win ratio, the key difference being the last 2 Wed are up, & last 2 Thur are down.
20230901-DoW.png


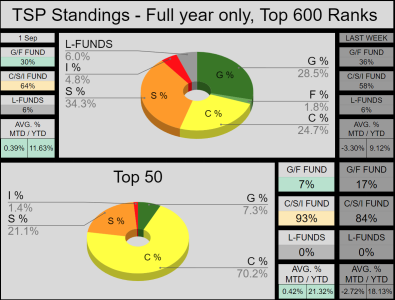
Last week for the AutoTracker was good, the Top-600 gained 2.51%, and shifted a 5.5% allocation into the C/S/I Funds.
20230901-AT.png


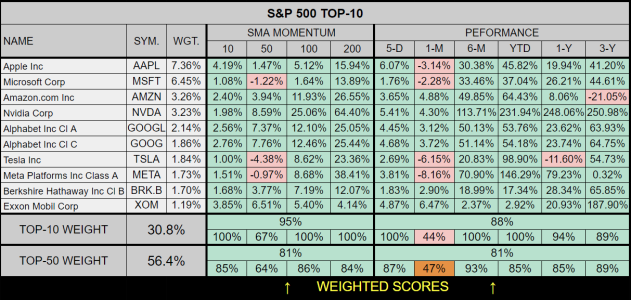
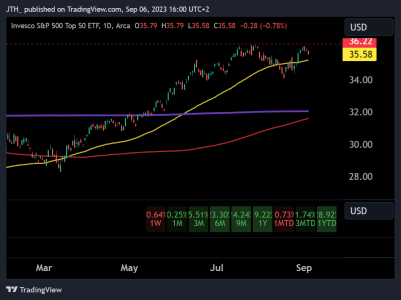
The S&P 500 is up 17.61% YTD. By Index Weight, the Top-10 is up 22.21% and the Top-50 is up 26.09% There is an ETF which tracks the Top-50, XLG. it’s not an exact replica of the data I’m using, but it’s pretty close. This ETF is up 29.83% YTD
20230901-TOP-10.png
 
Good morning

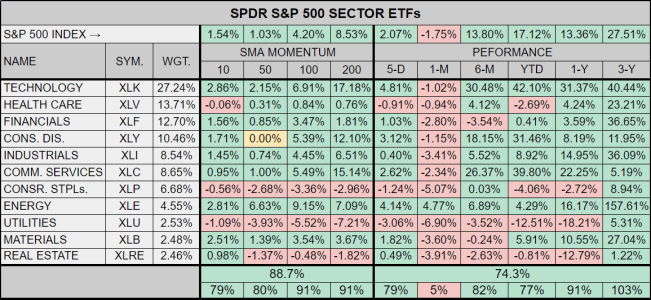
Across the 11 SPDR Sectors, only Energy's XLE has broken into new recent highs. All other sectors have recently put in lower highs. Off the July highs to the most recent lows, Consumer Staples & Utilities have gotten hammered, losing 6.46% & -11.29%.

As I'm looking at it, it's the Top-50 holding us up, it's essentially made a double top, maybe we can breakout, but with the exception of Tech, Consumer Discretionary & Consumer Services, sector participation YTD has been poor.

TOP-50 ETF XLG
20230901-SPDR-14.png

20230901-SPDR.png
 
Good morning

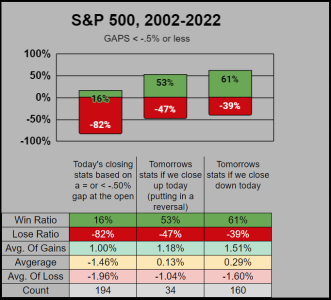
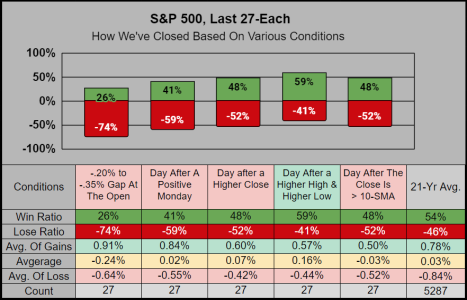
This morning the S&P 500 gapped down at the open -.69%

From the previous 21 years, the day of the gap-down -.50% or less had a 16% win ratio. (Total count of 190 days)
If the gap-down day reversed and closed up, the next day's win ratio was 53% (Small Count of 34).
If the gap-down day closed down, then the next day's win ratio was 61% (Count of 160)
If this 61% day closed up, then the following day's win ratio (not shown) was 50% (Small Count of 49)

20230901-GAP.png

 
God bless you for keeping us safe.
D

Thanks DannyBoy it's much appreciated. While the graph says 194 days I typed 190, but yes it's 194. For myself, I'm entertaining a partial IFT tomorrow, or Monday, but I'd like to see tomorrow put in a lower low and lower high.
 
Good morning (some random thoughts)

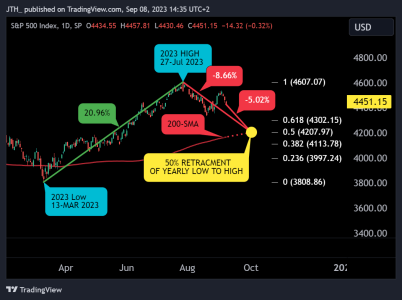
SPX 4207 is a 50% retracement of the Yearly Low to High. Perhaps in October the 200-SMA can climb to this level, and provide support for a test. From current levels a test of 4207 is -5.02% below us, and -8.66% below the yearly top.
20230908-FIB.png

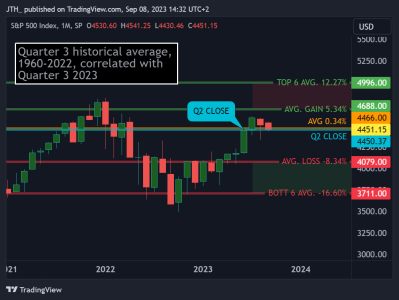
3rd QTD we are up .02%

From 63 years, the 3rd Quarter win ratio is 63% and the 4th Quarter’s win ratio is 73% with an average-of-gains of 7.11%

Of the 23 times Q3 closed down, Q4 closed up 18 of 23 times giving us a 78.3% win ratio, with an average-of-gains of 8.67%. Inversely, of the 40 times Q3 closed up, Q4’s closed up 31 of 40 times giving us a similar 77.5% win ratio with an average-of-gains of 6.21% So from this perspective, the difference between a negative & positive 3rd quarter is not so much in the 4th quarter’s win ratio, but in the potential for higher average-of-gains.
20230908-QRT.png
 
Good morning


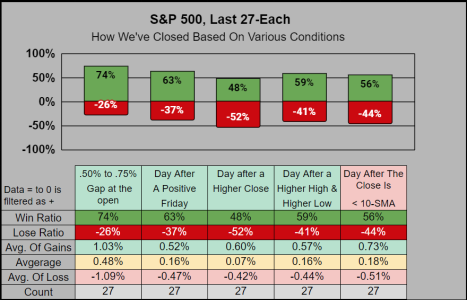
Today’s trend analysis suggests a 60% chance of a .69% gain.

20230908-MON.png

___
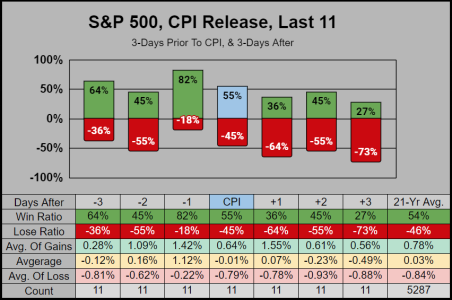
The CPI report is this Wednesday the 13th. Here’s a review of the past 11 reports. It would appear the days before CPI are stronger & the days after are weaker.

20230908-CPI.png

___
We’ve finished the first 5 trading days into the September MTD historical range. We are now entering what is traditionally the strongest 6 trading days of September. CPI Reports on trading day 8. Within this 21-year perspective, trading day 8 is crucial. Of the 9 times we were down MTD on trading day 8, we closed the month down all 9 times.

20230908-STAT-RNG.png
 
Good morning


Today’s trend analysis suggests this Tuesday has a 56% chance of a -.52% loss. Preliminary data suggest if today meets these expectations, tomorrow’s Wednesday may yield similar results.

20230912-TA.png


___
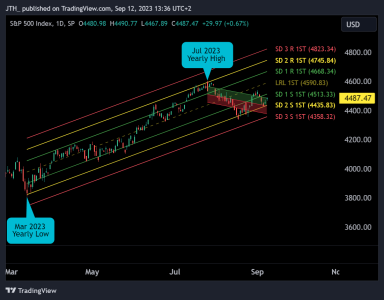
This Monday marked half a year or 126-days since the March 2023 yearly low was established. From the 126-Day Linear perspective, we are inside Standard Deviation 2 (where 95% of prices are expected to reside). Long-Term, our channel is rising, and we are oversold.


From the July 2023 yearly high, we have the 30-Day Linear perspective, where we are inside Standard Deviation 1 (where 68% of prices are expected to reside). Medium-Term, this channel is declining, and we are overbought.

20230912-126.png

___

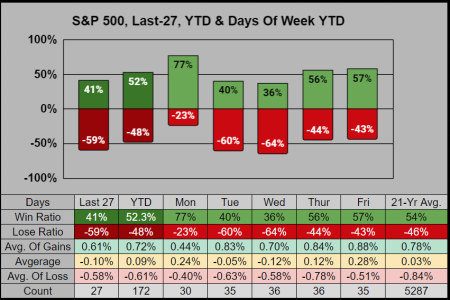
YTD Tue/Wed have the worst win ratios, but Thur has the strongest losses with the last 8 of 11 having closed down.

20230908-DoW.png

It should be an exciting week!
 
Good morning

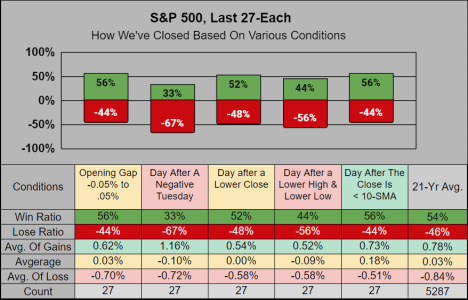
Today’s trend analysis is mixed, suggesting this Tuesday has a 52% chance of a -.62% loss or a 48% chance of a .71% gain. I do view today as having high potential for a reversal, so if the IFT-deadline looks to be in the green, then I would statistically make the assumption we’ll close in the green and mark this as a potential reversal day. Either way, it could prove to be a very whippy day where an IFT entry/exit could go counter to your expectation.

20230913-TA-05.png

___
My uneducated guess, thus far this September has been a continuation of August. Adding to this, it appears we’ve been hedging for a bad CPI report. August core inflation, excluding food and energy, rose 0.3% hotter than expected.


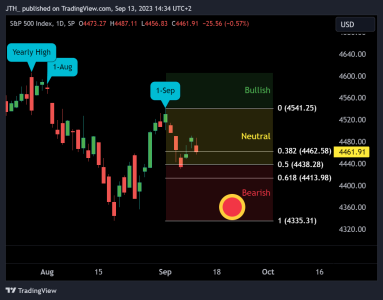
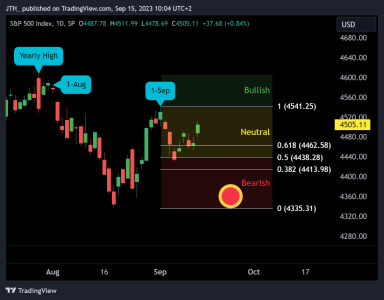
An observation: The 1st day of August was the highest close of the month, it took 14-trading days to bottom out at -5.44%, recovering off the bottom we closed down -1.77%. Thus far the 1st Day of September has been the highest close of this month. Overall I view trading days 13-16 historically as the worst for September, so that’s where I might expect to see an intra-month low if traditional seasonality plays out. The chart below outlines the levels I think are important for September.

20230913-CHRT.png

For myself, IFT-wise, I'd like to get a partial entry below SPX 4440, then either exit higher, or take more risk on at lower levels and potentially ride into an October bull-run.
 
Last edited:
Good morning


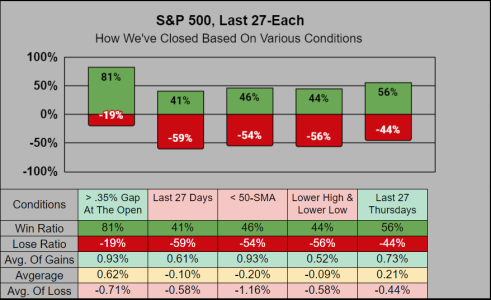
Today’s trend analysis suggests this Thursday has a 58% chance of a .74% gain. For today, a higher high & higher low would be ideal, with a minimum gain of .33% which would also give us a close above the 10 & 50-SMA.

20230914-TA.png
 
Good morning


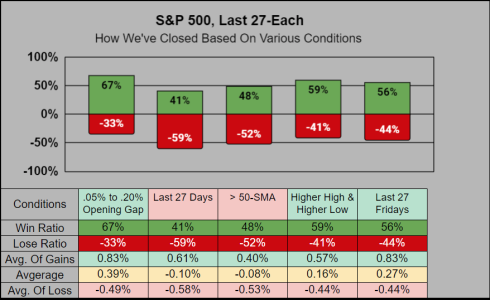
Today’s trend analysis suggests this Friday has a 57% chance of a .65% gain. I’ll be traveling, so I’ve posted this earlier than usual. While the opening gap data may change, overall I do think this is how the day should play out.

20230915-TA.png


___
Observation: All 11 of the SPDR Sectors closed positive on Thursday, this hasn't been the norm. Perhaps it's indicative of broad-based buying, where hesitation has eased.


As it stands now, we are only -.06% MTD, and .81% under the September Top.

Question #1, If we revisit the Sep Top, then why revisit the Sep Low this month?
Question #2, Will a breach above the Sep Top revisit the 2023 High?
Question #3, Will a revisit of the yearly high be a Major Double-Top, followed by an October pullback?

Since it’s Friday, I would make the guess we’ll close just under the September High, this will leave us an unanswered question to digest over the weekend. Monday will be trading day 11, the last “supposed” day before we hit a 5-day patch of negative seasonality. Historical data would leave me to believe that trading day 11 will be the Intra-month high, we’ll see if the markets agree (they rarely do).

Have a great weekend!

20230915-CHRT.png


Today’s trend analysis suggests this Friday has a 57% chance of a .65% gain. I’ll be traveling, so I’ve posted this earlier than usual. While the opening gap data may change, overall I do think this is how the day should play out.

Bummer, since the pre-markets turned down, here's a revision. So now it's 53% chance of a .63% gain, vs. a 47% chance of a .49% loss.
 
Back
Top