JTH's Account Talk

Re: MONTHS

100% "S" fund, 11.90% YTD. Still down 24.18% from my high back in November 2021. If I get my act together, I will be 100% out of TSP by the end of summer. Going to roll everything over to my Edward Jones account. Next year I am going to have to start taking money out and I don't want to do it from two different accounts.

I hear ya, I'm glad to have rolled out of TSP, currently sitting 62% cash that's getting around 5%. I still have about 22 years to let it stew before making withdrawals, thank goodness I don't need the money, I'd like to pass it down to my kids.
 
Good morning

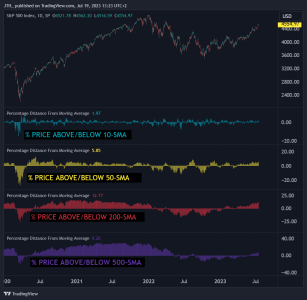
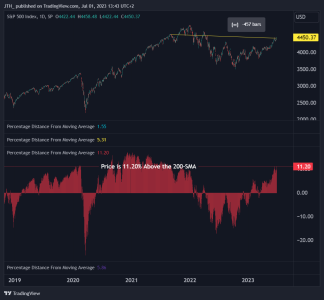
The S&P 500’s price is 11.20% above the 200-SMA. Compared to the previous 21-years, this is in the top 9% (Percentile range). This is the highest we’ve been above the 200-SMA since 3 Sep 2021 or 457 trading sessions.

More info can be found in
STATS FOR Q3 & STATS FOR JULY

20230701-200-SMA.png
 
Good afternoon

For those of you who get to enjoy a 4-day weekend, I have to say I do miss the BBQ culture of the states, somebody please burn me a hotdog :)

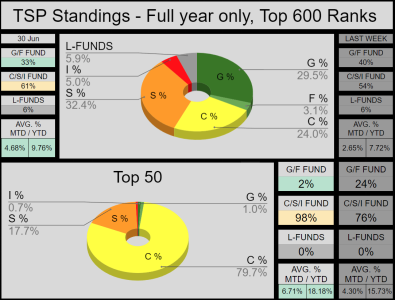
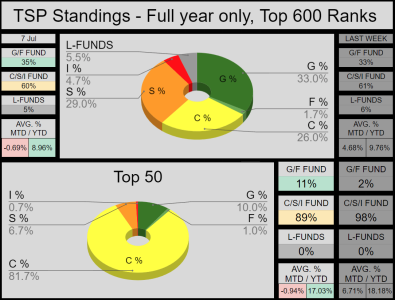
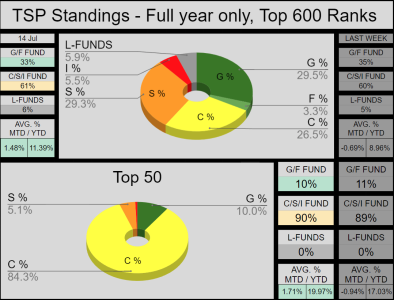
The Top-600 gained 2.03% last week, there's a pretty good mix between the G/C/S funds.
20230701-AT.png


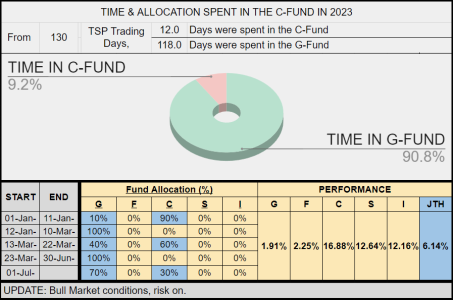
Report card time: On Friday I made the strategic decision to buy 30C at the top of the market....

Seriously though, I really do detest taking an entry at these levels, but given the 2-IFT entry limit, these are the cards dealt. So if prices go south from here, I'll look to buy more with July's 2 IFTs. If we go higher, then it's the typical exit IFT-1, and re-enter on IFT-2. At best, I'll look to narrow my -10.73% performance gap against C-Fund.

20230701-JTH.png
 
Good morning

Perhaps Tuesday's holiday will make for a light week in the markets?

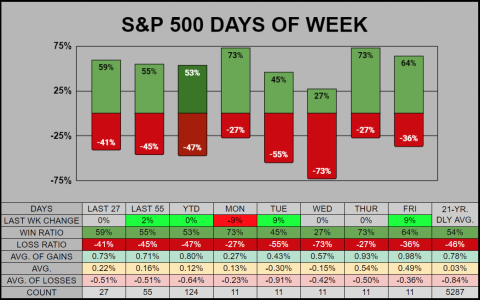
The last 7 Thursdays have closed up.
20230701-DoW.png
 
Good morning

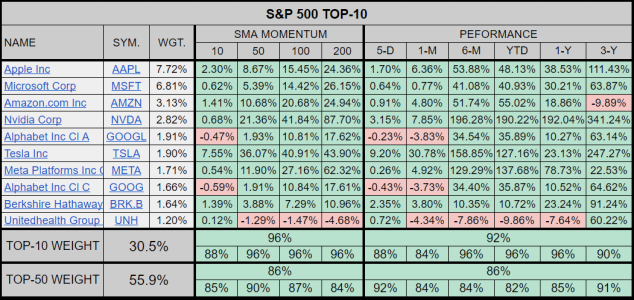
Currently the S&P 500's weighted Top-50 makes up 55.9% of the Index.

10 of 50 are trading below their 10-SMA.
_4 of 50 have a negative 5-day performance.

20230701-T-50.png

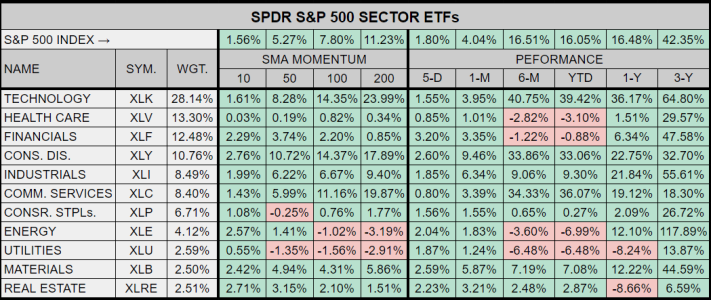
The SPDR Sector ETFs are also performing well.

20230701-SPDR.png
 
Good morning

Starting the week off, the Top-50 are nearly 82% allocated into the C-Fund.

20230707-AT.png


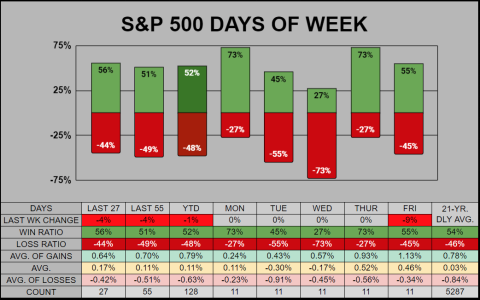
For the Day-of-Week stats, Friday has picked up some weakness, while Wednesday continues to be a stinker. The last 3 Wed closed down, & last 6 of 7 down.

20230707-DoW.png

 
Good morning

"The Nasdaq 100 special rebalance will take place before the market open on Monday, July 24, to "address overconcentration in the index by redistributing the weights." The Nasdaq has only conducted a special rebalance twice in its history: in December 1998 and May 2011."

"Based on Nasdaq 100 methodology, the combined weight of the five companies with the largest market caps will be set to 38.5%. The five-largest companies, Apple, Microsoft, Google, Amazon and Nvidia had a combined weight of 46.7%. That suggests some notable reduced weightings for these names.
_____

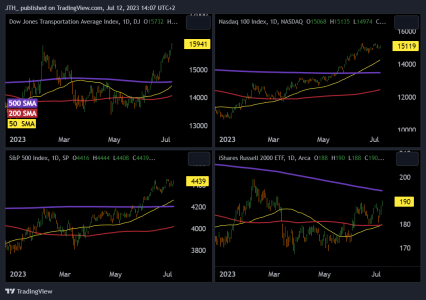
As for the 4-Horseman:

- Transports makes a Double Top, breaching its previous Feb-23 high.
- NASDAQ 100 & S&P 500 have a nearly identically candlestick pattern.
- Small caps have risen 5.18% in 4 days.

20230712-QUAD.png


Good morning

"The Nasdaq 100 special rebalance will take place before the market open on Monday, July 24, to "address overconcentration in the index by redistributing the weights." The Nasdaq has only conducted a special rebalance twice in its history: in December 1998 and May 2011."

"Based on Nasdaq 100 methodology, the combined weight of the five companies with the largest market caps will be set to 38.5%. The five-largest companies, Apple, Microsoft, Google, Amazon and Nvidia had a combined weight of 46.7%. That suggests some notable reduced weightings for these names.


Interesting information, but what does it mean for the market? Good day bad day don't know. What did the market do the last two times?
 
Interesting information, but what does it mean for the market? Good day bad day don't know. What did the market do the last two times?

My impression, those five-largest companies comprise about 24% of the S&P 500.
From 24-July if they were to give us a pullback, the NASDAQ 100 should fair better than before 24-July.

It's like they are stashing the gains, then rigging it to protect the profits on the next pullback. So with fuzzy math, under the old system, if those five-largest companies lose -20% then the NDX loses -9.34% under the new scheme it would be -7.7%
 
Re: MONTHS

Good morning

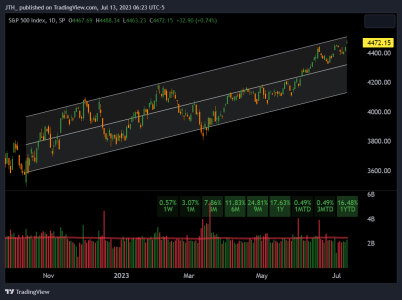
From the October 2022 bottom, we have a Linear Regression Channel with a Standard Deviation of 2

- The Channel is 185 trading days (bars) long, spanning 272 days
- Mathematically around 95% of prices will stay within 2 standard deviations of the mean
- From the channel's Oct-22 low to the Jul-23 high, the channel rises about 25.82%
- From the current channel top to the current channel bottom is about -8.35%

20230713.png

 
Looking like I could have eaked out a bit more, made my move yesterday.
Hard enough to read trends. ICBM's flying around makes me nervous.
 
Good morning

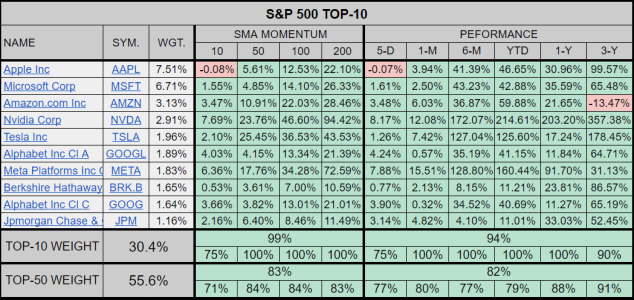
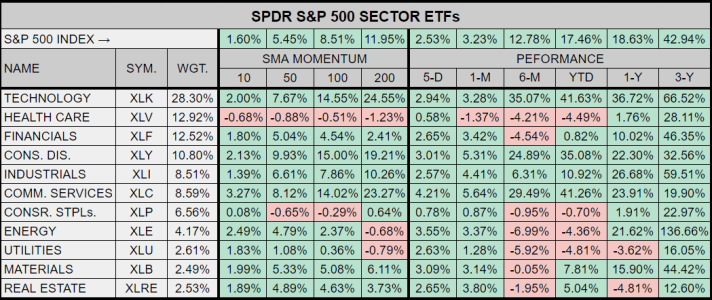
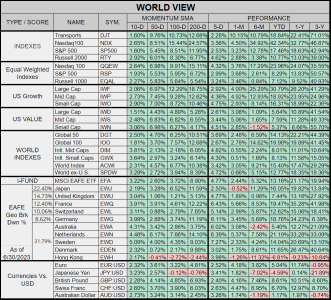
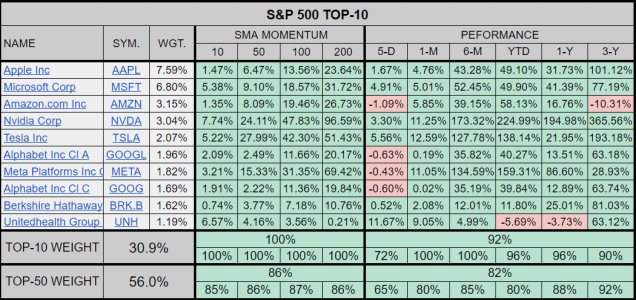
A quick view of the S&P 500's Weighted Top-10, the SPDR Sector ETFs, and the World's Indexes.

Banking's JPM climbed into the Top weighted 10, pushing out healthcare's under performing UNH.

20230714-T10.png

For the Sectors, one theme has been consistent this year, Healthcare is in the red.

20230714-SPDR.png

For the World view, in the short-term, we can see the USD is getting slammed by the major currencies.
The I-Fund is up 2.63% MTD

20230714-WLD.png
 
Good morning

Allocation wise, (as a whole) there was very little movement in the Auto Tracker from last week.
20230714-AT.png

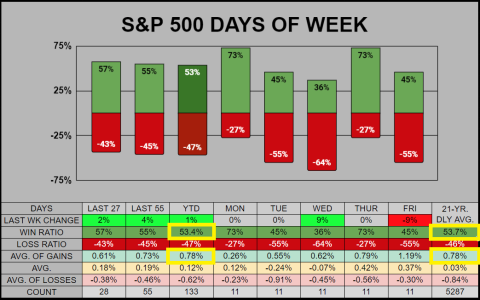
Looking at the Day of Week stats, the YTD 53.4% win ratio and .78% average-of-all-gains, is nearly identical with the 21-year averages.
20230714-DoW.png
 
Good morning

Funny thing is, most of the folks in my investment ecosystem have been wrong all year. This isn't to say anyone is short or losing money, but dammit everyone is making money, it sure would be nice to tip over the boat...

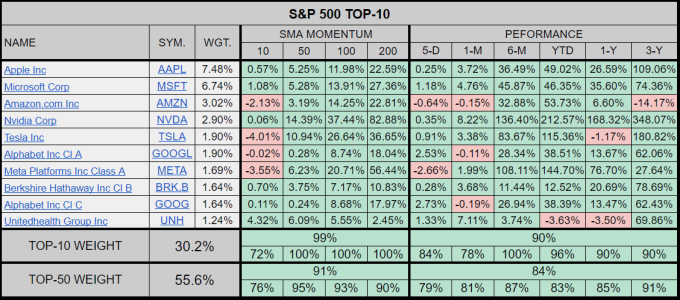
Anyways, the Top-50 Weighted S&P 500 stocks currently make up 56% of the index.

33 of 50 or 66% have a positive YTD.
21 of 50 or 42% are beating the S&P 500 YTD.

20230719-T10.png

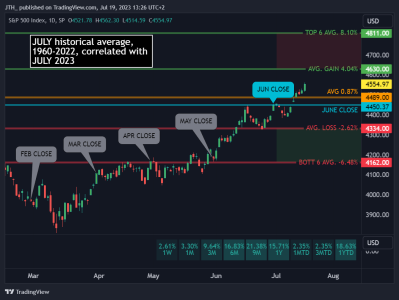
Regardless of the long-term performance, for the Monthly Projection's perspective, we still have have room to grow. The average-of-all-gains is at 4630 about another 1.65% from current levels.

20230719-MTD.png

Lastly, here's long-term view of where price resides within the major SMAs. Would you believe we are only 5.62% away from the all-time highs? This would give us a significant Double Top.

20230719-SMA.png


Last edited:
Good morning

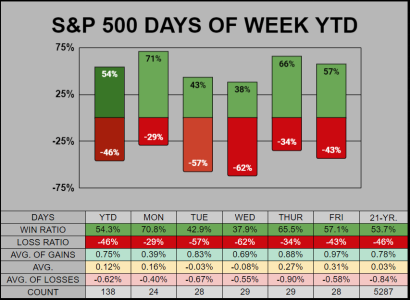
Here's a YTD view of the Mon-Fri chart.

Monday has the most Holidays, best win ratio, and least losses.
Tue/Wed have poor win ratios under the 21-year 54% average.
Thur/Fri have a good win ratio & have decent gains.

20230721-DoW-YTD.PNG

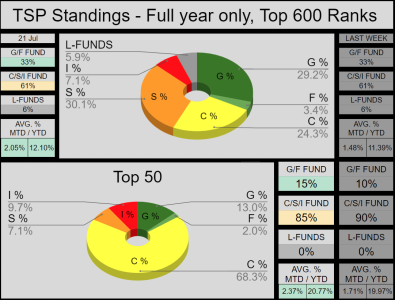
The AT-600's allocations haven't moved much, the Top-50 has a 68.3% C-Fund allocation.

20230721-AT.PNG


Good morning

Recently there's been some short-term weakness shown in the S&P 500's weighted Top-10. Otherwise, the Top-50 are still going strong, with 35 of 50 having a positive YTD.

20230726-T10.PNG

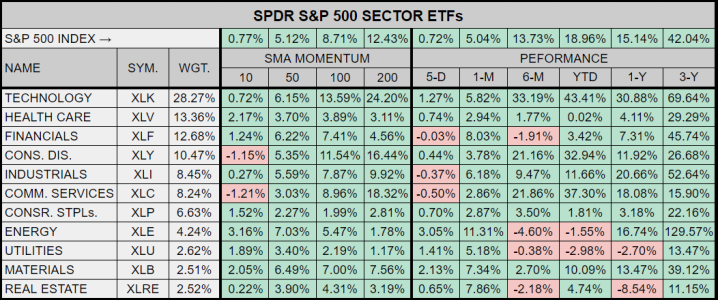
The SPDR Sector ETFs are doing well, even the underperforming real-estate ETF XLRE has been inching into the green.

20230726-SPDR.PNG

 
Good morning

Today is the last day of July, so tomorrow I'll write up a end of Month blog & post stats for Aug.

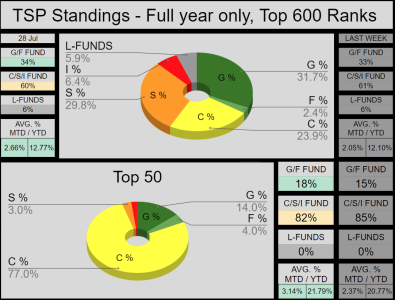
This week, the AT's Top-50 is largely allocated to the C-Fund while the Top-600 is more evenly distributed amongst the G/C/S funds.

20230728-AT.png

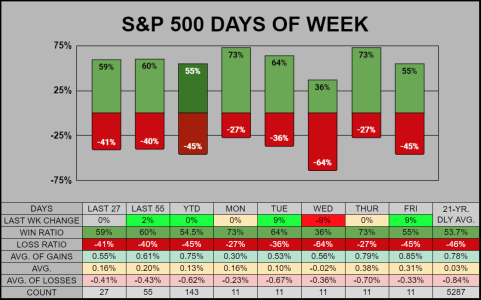
The Day of Week stats look pretty good, with only Wednesday underperforming with a 36% 11-day win ratio.

20230728-DoW.png

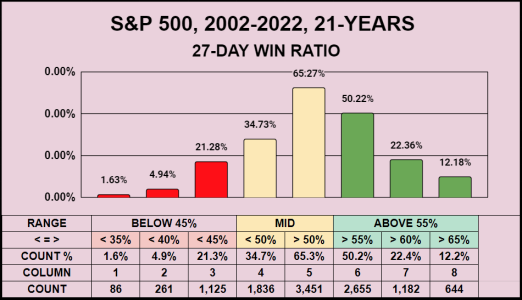
The current 27-day win ratio is 59.3%. From the previous 21-Years across 5287 trading sessions (in today's terms) we are currently above average in column 6:

The average win ratio was 53.8% the median was 55.6%.
The lowest win ratio was 22.2% the highest was 77.8%

20230728-DoW-27.png
 
Back
Top