JTH's Account Talk

Post 2 of 2

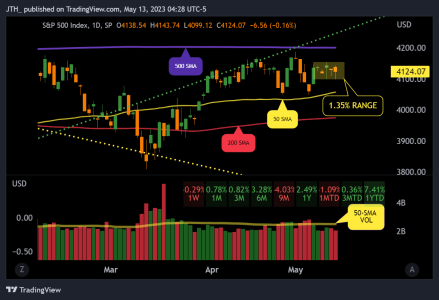
Over the past 5 sessions we've been in a tight 1.35% range, and volume has been light (under the 50-SMA-VOL).
SPX_DAILY
20230512-CHRT.png

___
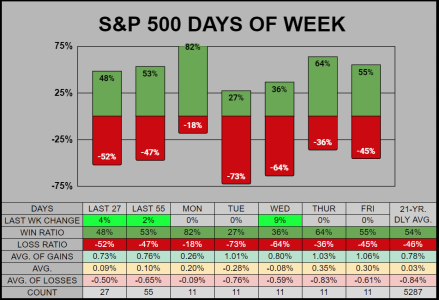
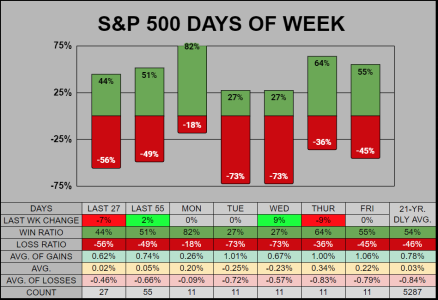
Statistically speaking, it's much the same as I've reported over the previous 3 weeks, Mon/Thur good, Tue/Wed bad, Fri meh. The last 7 of 11 days down, last 3 Tue down, last 2 Thur down.
20230512-DoW.png

___
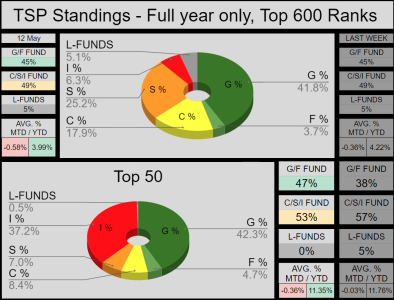
The AT's Top-600 lost -.24% last week, while the Top-50 lost -.41%
20230512-AT.png
 
Good afternoon

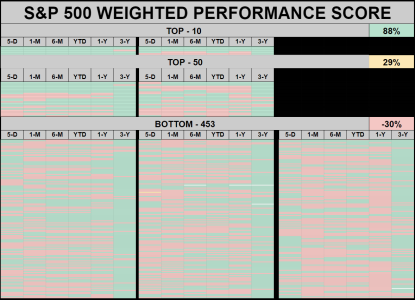
This is a market carpet, of the S&P 500's 503 stocks sorted by weight. Green is above and red is below the various timeframes. My weighted score for the Top-10 is 88%, and the Bottom-453 is -30%

The further you go down the chart (in weight) the worse the performance, hence the sea of red...

WEIGHT.png
 
This sheds light on the discrepancy between the 2023 returns of the C-fund (9%) and S-fund (4%). When you buy the C-fund, you are actually buying these top 50 companies that make up the S&P 500.
 
This sheds light on the discrepancy between the 2023 returns of the C-fund (9%) and S-fund (4%). When you buy the C-fund, you are actually buying these top 50 companies that make up the S&P 500.

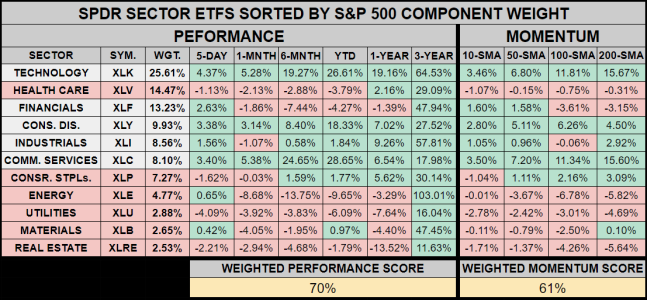
Yea, it's been an issue with me all year long with Tech's sector performance, while the other sectors are stalling/dragging us down. I'm definitely underweight tech, but I only allocate 23% to the sectors and just refuse to throw too much money into Tech at these levels.
 
Good morning

The large cap rally continues. Both Performance and Momentum show Tech's 26% index weight is keep these markets above water. The Sector names I highlighted in red make up a combined 35% of the index, and they are underperforming.

20230519-SPDR.png


___
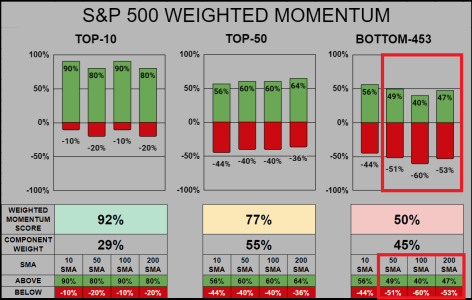
I've started assigning Weighted Momentum Scores, equally weighted across the various moving averages. Here we can see that as we transition down by index weight, the SMA momentum begins to decline, simple put, this is a Large Cap Rally.

The Top-10 are on fire.... 92%
The Top-50 are doing very well... 77%
The Bottom-453 are sucking wind... 50%

20230519-SMA.png


Good morning

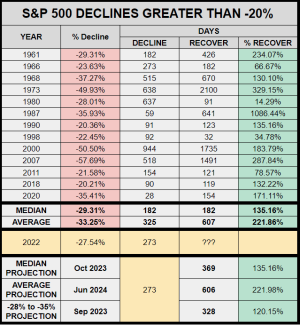
Going back to 1960, I've annotated the previous 13 declines of -20% or greater.

Year 1973's -49.93% decline took 2100 days to recover prices, that was brutal. Perhaps more brutal was in year 2000 which took 2679 days to both decline and recover prices. Based on this very limited data set, I've estimated the potential to will recover from 2022's decline to be as early as Sep 2023 and as late as Jun 2024.

20230519-PROJECTION.png


Re: MONTHS

Good morning

A commonly held truism, a Bull Market is defined as 20% or more in a broad market index over at least a two-month period. By this standard, can we surmise we've entered a bull market?

33% rise from SEP-FEB on the Transports
32.89% rise from OCT-MAY on the NASDAQ 100
20.66% rise from OCT-MAY on the S&P 500
22.62% rise from OCT-FEB on the iShares Russell 2000 ETF

There is only a slight problem, in April, the Transports & R2K have given back over -15% so essentially only 2 of the market's 4-Horsemen are participating in this recent rally.

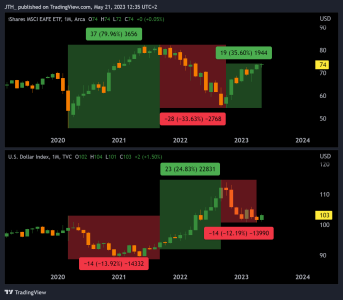
Meanwhile EFA's direct correlation with the dollar over the past 38 months is impressive. A perfectly timed trade between these two would have yielded a 204.61% profit.

MONTHLY EFA & USD
EFA.png

____
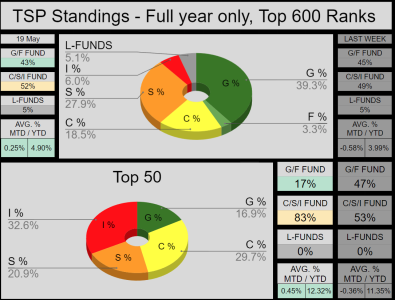
Members in the AutoTracker had a decent week, the Top-600 gained .91% and the Top-50 gained .97%
For the Top-50, this is the most evenly distributed I've seen our fund allocations.

20230519-AT.png


Re: MONTHS

​Good morning

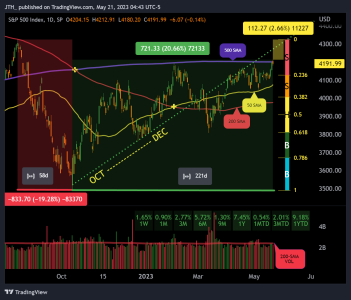
In the upper right yellow box, where we need another 2.66% to re-test the Aug high, which could also test the OCT-DEC trendline.

CHART.png

___
Across the Day of Week stats, last 2 Mon/Wed closed up, last 5 Tue closed down, and the last 2 Fri close down.

20230519-DoW.png
 
Re: MONTHS

Good morning

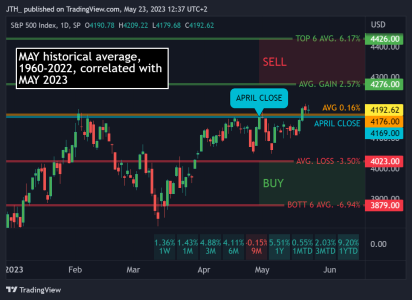
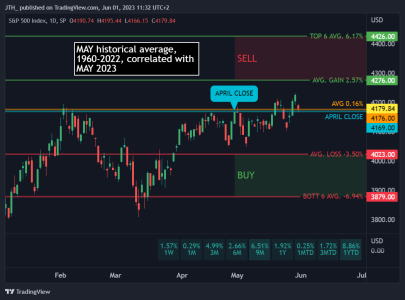
Here's a quick update of May's 63-Year historical comparison with this month. We are still in the "Mushy Middle" but at the very least we've pulled above the .16% historical average (of all closes)

20230523-CHRT.png

___
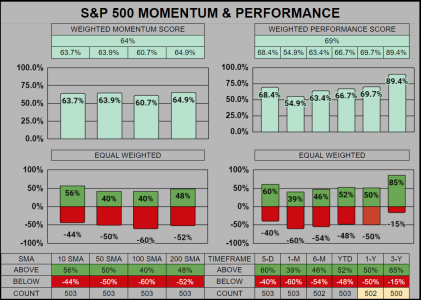
Going down another rabbit hole, I've been working on consolidating the S&P 500's Index by sorting the individual 503 holdings by both weight & equal-weighted momentum & performance.

Based on weight, we can judge how well the index is performing across the various SMAs and timeframes, this is the better indicator of the S&P 500's performance. Based on equal-weight, we can judge how well all the stocks are performing regardless of the pull they have (or don't have) on the index.

Looking at this view, we can see the weighted scores (ranging 0-100%) are healthy, while the equal-weighted are significantly weaker on the 50/100 SMAs and the 1/6 Month timeframes.
20230523-M&P.png


Re: MONTHS

Good morning

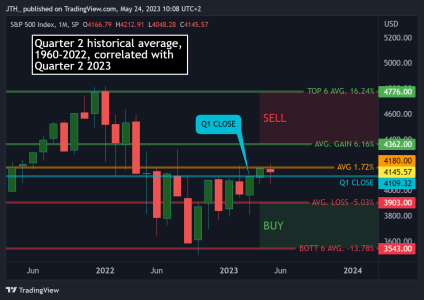
A quick glance at the historical 2nd Quarter chart shows a similar position to the previous Monthly May chart I posted.
20230524-CHRT.png

___
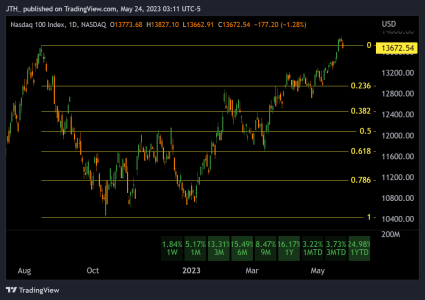
I hadn't noticed, but the Nasdaq 100 breeched it's previous Aug high. Generally speaking, from previous scans I've done. 1 of the 4 indexes (Tran. NDX100, SPX, R2K) can pull the entire markets up, but it's significantly better when at least 2 of these indexes are participating.
20230524-CHRT-NDX.png
 
Good morning

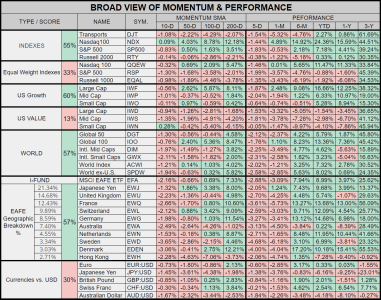
Looking at a broad overview, here are some key points.

The weighted indexes are outperforming their equal-weighted counterparts.
Growth is significantly outperforming Value.
The USD is hindering the performance of the I-Fund.
20230525-WLD.png

 
Good morning

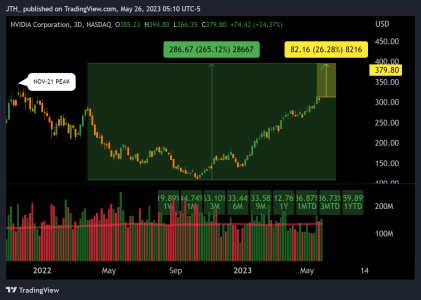
With Monday's holiday, perhaps we'll get some lighter than normal volume today and next week. Either ways, the AI story continues to dominate the Tech theme, "All hail Tech".

Nvidia gained almost 25% in one day, 265% off the October bottom, and has breached it's previous November 2021 market peak. Crazy to see this on a top-10 stock.

20230526-NVDIA.png

___
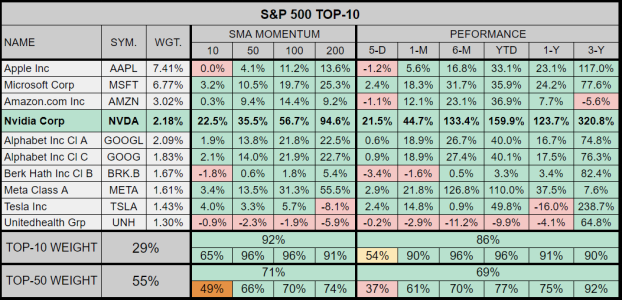
Meanwhile, the Top-10 continue to drag us higher.
20230526-T10.png


___
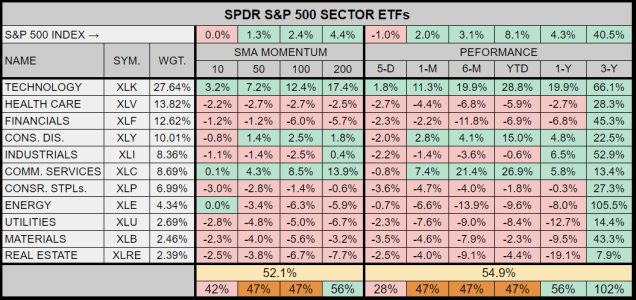
As for Sector performance, once again it's Tech's 28% weighting and performance leading all sectors.
20230526-SPDR.png
 
Good morning

On the S&P 500, for 2023 with 101 trading days in the books, the 10-Best days added together equal 17.38% and the 10 worst days added together equal 15.46%

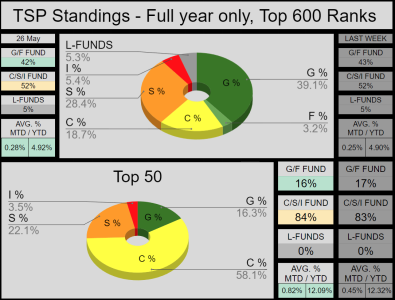
From Friday's close, the C-fund is outperforming its counterparts, with the Top-50 having a 58% allocation. Interestingly, while the C-Fund is up 10.27% YTD, the average YTD on the AutoTracker is 4.92% (less than half).
20230526-AT.png


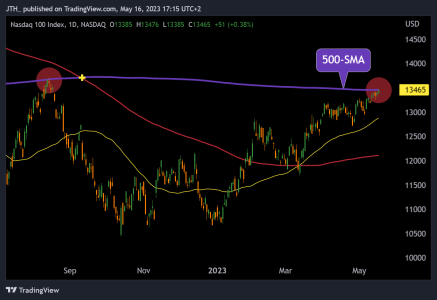
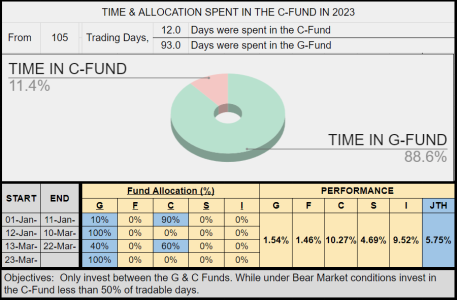
For myself, using a long-term perspective on the AutoTracker, I'm getting close to changing from Bear Market Conditions to a Neutral Reading. It's a simple judgment based on the 500-SMA which is my line in the sand on long-term charts.

TRAN is Bearish
NDX-100 is Bullish
SPX is Neutral
IWM is Bearish
20230526-JTH.png

A small reminder: From 1960-2022, June is the beginning of the worst 4 months of the year. June is also the 2nd month within the worst 5 & 6 Months of the year.


Good morning

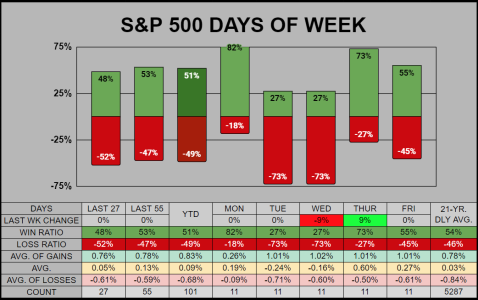
Since we've crossed the 100 trading day mark, I've added a YTD column which shows thus far 2023 has a 51% win ratio.
So at the moment, we are under the previous 21-year 54% win ratio. But the good news, (when compared to the 21-Yr averages) we have higher a positive average at .83%, a higher average at .09% and a lower negative average at -.68% So, yes we are winning less often, but we are making more gains. :)

Monday: Last 3 closed up, last 9 of 11 have closed up.
Tuesday: Last 5 have closed down, last 8 of 11 have closed down.
20230526-DoW.png

 
Good morning

I'm back in the states for a few weeks, so it will be interesting to adjust to the Market's timezone. Anywho, we've closed out the Month of May with a .25% gain. Going back to Mays from 1960, this May ranked 37th of 64 (very average).

20230531-MAY.png


Re: MONTHS

Good morning

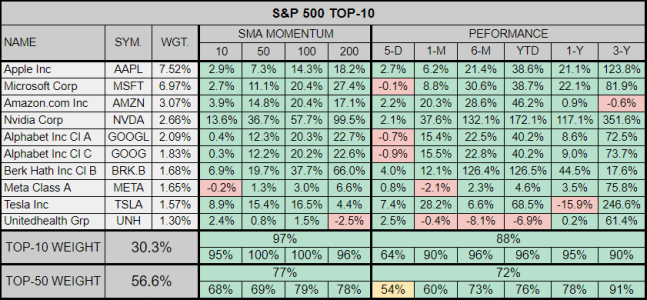
The S&P 500's weighted Top-10 now comprise 30.3% of the index. There's a lotta green across the Top-50's SMAs & Timeframes.

20230602-T10.png
 
Re: MONTHS

Good morning

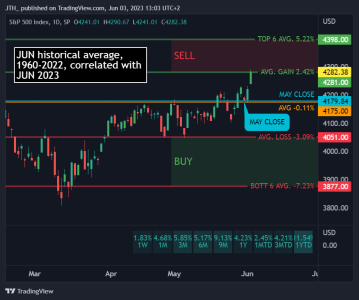
From Friday's close, we've reached the previous 63-year average-of-all-gains for the Month of June.
20230602-STATM.png

For the Day Of The Week Chart, MON/TUE/FRI Good, WED/THUR bad :)
View attachment 58196


Re: MONTHS

JTH, Great charts but I think you need a slight correction for your days of the week profit/loss.
 
Back
Top