JTH's Account Talk

Good morning

Friday fell short of my expectations, I hadn’t realized why, until Tom mentioned something in his Market Talk thread.

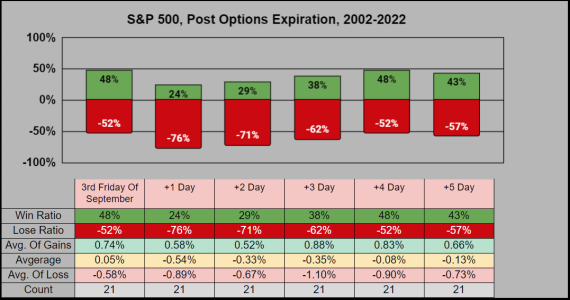
“The recent track record of Friday quadruple witching expiration day in September has been pretty bad, and next week (post Sep expiration week) has a negative bias, and a poor one at that, but sometimes the Monday of post expiration Sep is actually up before a decline into the rest of the week.”

I don’t normally track Options Expiration, but inlight of getting blindsided, I thought I should post September's Historical stats based on the 3rd Friday’s Expiration, and the following 5 trading days after. This somewhat falls inline with trading days 12-16 (Tue to Mon) being statistically the weakest period of September.
20230915-OptEx.png
 
A not so quick update.

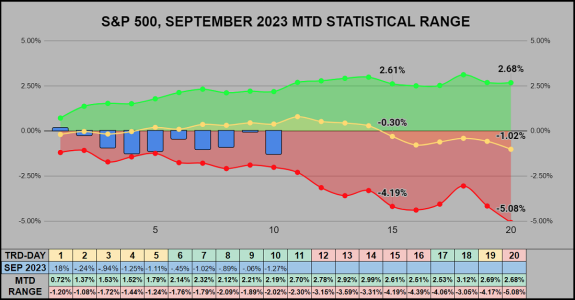
Having finished 10 trading days, MTD we are down -1.27%. From the previous 21-years, of the 8 times we were down MTD on trading day 10, we also closed the month down.

20230915-MTDR.png

___
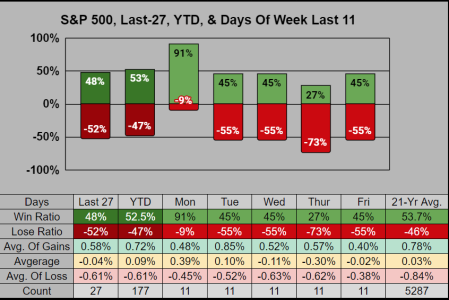
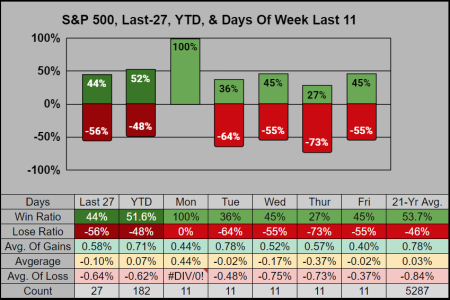
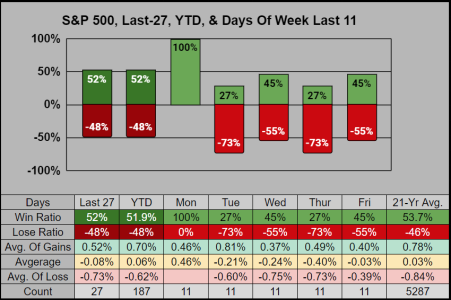
On our Day of Week chart, this might be some of the lowest win ratios I’ve posted. We have 3 days tied at 45%, & Thursday at 27%.


Monday’s 21-year win ratio + 2023 is 53% across 1,022 trading sessions. The last 10 of 11 Mondays have closed positive at 91% We did a similar 10-run back in July 2020 and even an 11-run back in June 2005. Regardless, the Monday win ratio phenomenon is inflated, and at some point in time we might expect this to average back down.

20230915-DoW.png

___
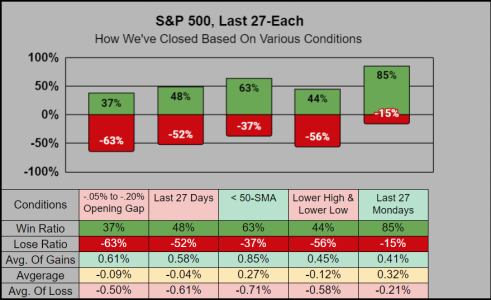
For today’s trend analysis, it’s mixed. The 1st column (the gap data) is statistically the most accurate & useful in the short-term (when applying an IFT). This combined with the market’s direction at the IFT-Cutoff, makes for a great combination.


Trading the direction of the opening Gap & IFT-Deadline: From the previous 27 events where both the index gaped up, and the IFT-Deadline’s 11:59 candlestick closed higher (than the previous day’s close) the index win ratio (how the day closed) was 81%. When both the Gap and IFT-Deadline were down, the day’s lose ratio was 96%

20230915-TA.png

___
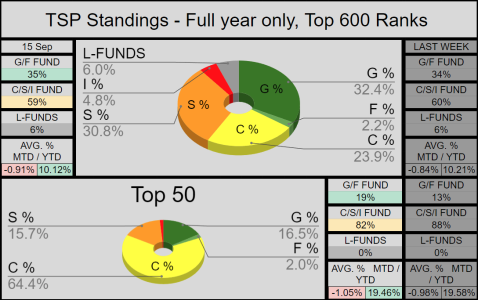
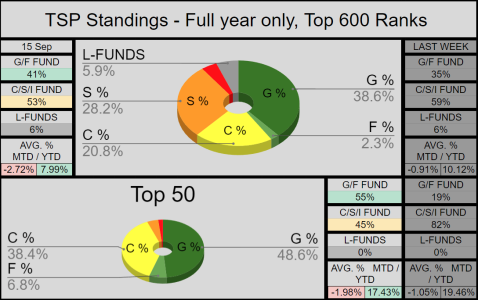
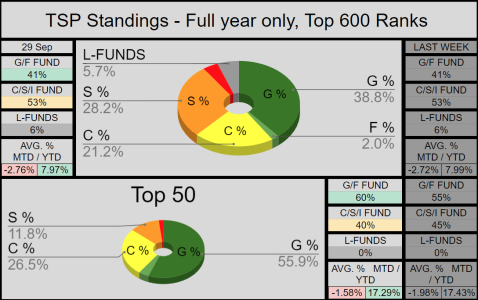
While it wasn’t a great week for the AutoTracker, the Top-600 are still up 10.12% YTD, and the Top-50 are nearly twice that at 19.46% YTD.

20230915-AT.png
 
Good morning


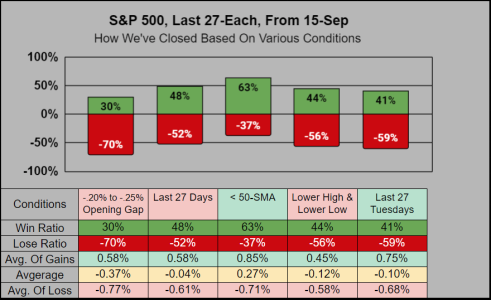
For today’s trend analysis, the premarkets flipped over to red and gaped down -.22% on the open. From the statistical viewpoint, it looks like today will be a down day.

20230919-TA.png
 
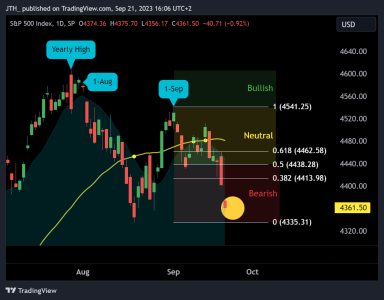
For myself, IFT-wise, I'd like to get a partial entry below SPX 4440, then either exit higher, or take more risk on at lower levels and potentially ride into an October bull-run.

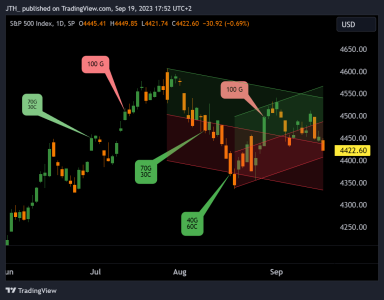
Another glorious day of battle.

IFT EoB today 70G/30C

20230919-CHRT.png


Good morning


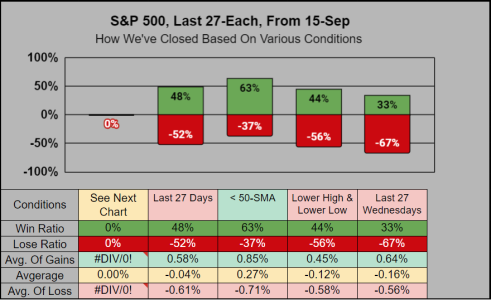
I won’t be home for the open, so for today’s trend analysis, I’ll post the Gap data separately.

20230920-TA.png

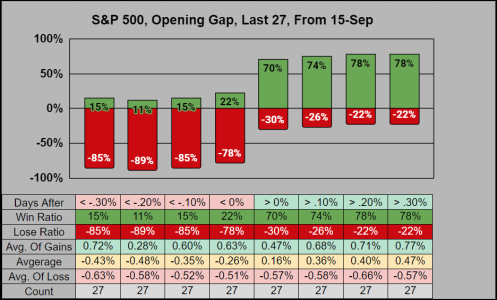
Here's the range of opening gaps vs. how the day closed.

20230920-GAP.png


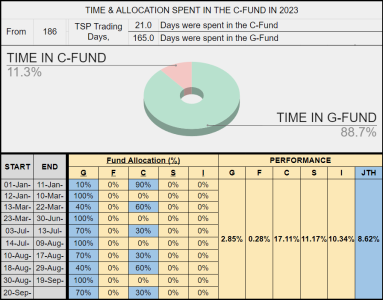
Report Card Time.
When I said I wanted an entry below SPX 4440, I did not mean I would be happy with 4443.96 ;damnit

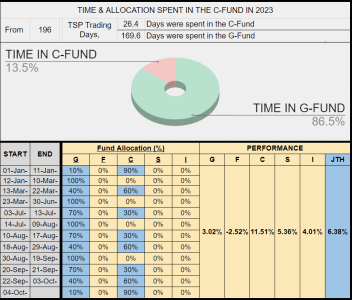
The C-Fund has an 8.50% edge over me. If I wanted to cherry pick the data, I’d tell you I’ve taken 88.7% less risk while earning 50% of the gains. While it’s fun to say that, it still doesn't outperform the Index…

TSP.png
 
Good morning

This morning the index gapped down -.67%

The last 27 times SPX gapped down < -.50%, the day closed up 2 times.

At this moment, we are both in range & time of the chart below, which was posted a few days back.

20230921-1.png
 
Good morning

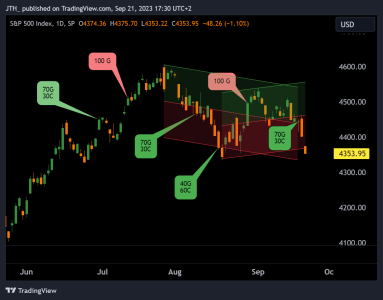
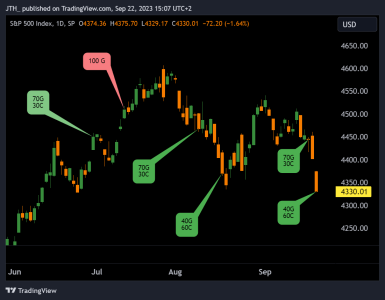
For myself, I’ve met September’s 2-IFT limit and I’m satisfied with the entries. If we go lower in October, then I’ll take another entry, if we go higher I’ll take a partial exit, then look to re-enter at lower levels.

20230922-TSP.png
___
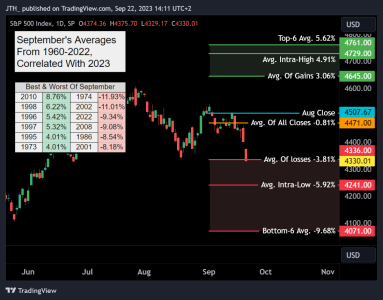
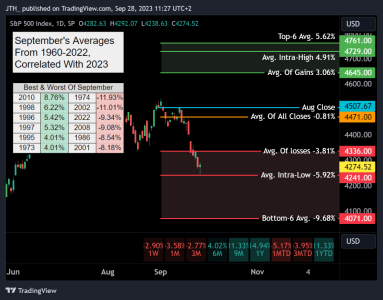
On the 63-Year Historical September chart, we’ve breached -3.81% which is the average-of-all-closing-loses, (from the 35 times September closed down). I like these levels but I’d also like to see if we can go lower.

20230922-MTD.png

___
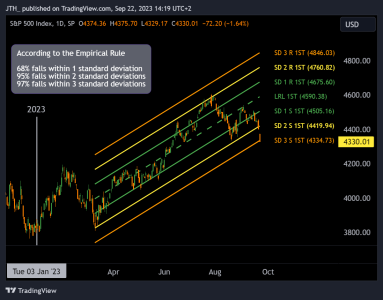
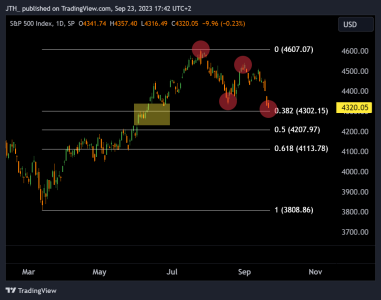
From the March 2023’s Yearly low, we are 134 sessions into the linear channel, we’ve just pierced standard deviation 3. In theory, this just might be a great time to buy…

20230922-LR.png

 
Good morning

Tied with June 2005, we now have 11 straight positive Mondays, while the rest of the days-of-week are under the 21-Year 54% average win ratio.

20230915-DoW.png


___
Meanwhile the AutoTracker’s Top-600 & Top-50 have taken off some risk with a sizeable shift into the G-Fund.

20230915-AT.png

___
Having finished 15 trading days, MTD we are down -4.16%. We can see we are within range of the negative averages, which shows this Monday might be the peak of this 5-day downturn.

20230915-MTD.png


___
A long-term Fibonacci chart drawn from 2023’s yearly low & high, shows we are within striking distance of the .382% Fib level at SPX 4302. From this timeframe, It appears to be a normal retracement which still looks healthy. Still, from here we can clearly see we’ve established both a lower high & a lower low, so we could definitely say we are currently in a downtrend.

20230915-FIB.png
 
Good morning

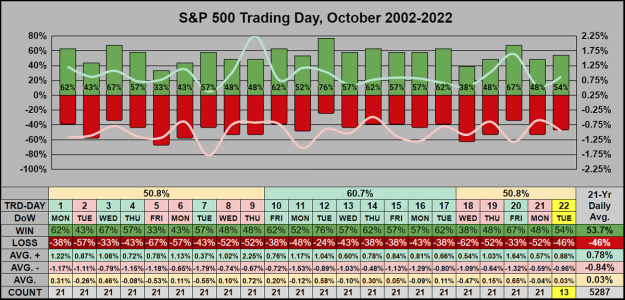
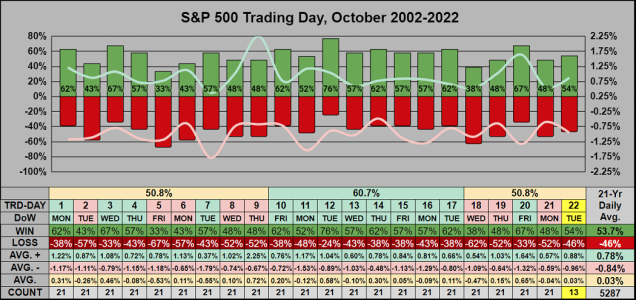
Here's a peak into October, there are 22 trading days, with no holidays.

From 63-Years on the Monthly timeframe October has the 5th best Win Ratio at 62%. The 2nd best average-of-gains at 4.26%. The 4th best average at 1.09% & the 2nd worst average-of-losses at -4.05%.

From 21-Years on the daily trading day timeframe.
The first 9 days are mixed, days 10-17’s mid month hump look good, while the end of month is mixed.
20230926-OCT.png
 
Good morning

8-SEP
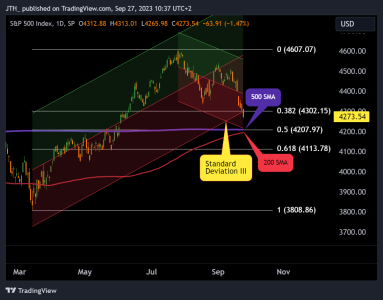
SPX 4207 is a 50% retracement of the Yearly Low to High. Perhaps in October the 200-SMA can climb to this level, and provide support for a test.
It will only cost us -1.36% to test a 50% retracement of the yearly low-to-high. At this level, we have the rising red 200-SMA on a path to cross above the purple 500-SMA. Add to this, from the July Yearly high, the bottom of standard deviation 3's linear channel resides close to this level.

20230927-CHRT.png
 
Good morning

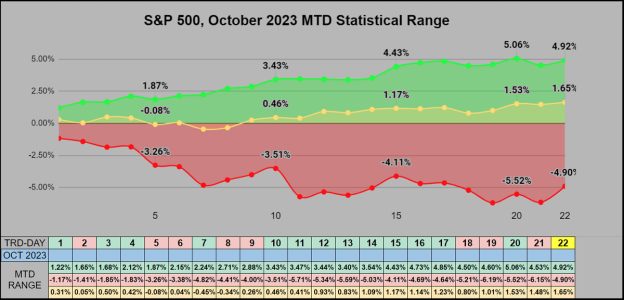
Here's a preview into October's MTD statistical range. From the previous 21-years, if the 1st day of Oct closed up, the month closed up 10 of 13 times. If the 1st day of Oct closed down, the month closed down 4 of 8 times.

20230928-OCT-MTD.png

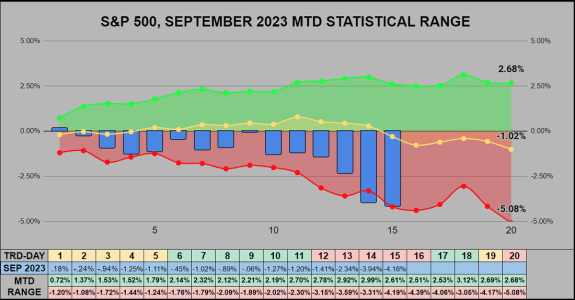
Also, on Wednesday we've kissed September's average intra-month low (the average % low of months which closed down).

20230928-OCT-MTD-1.png
 
Last edited:
Good morning

Since 2002, this is the first time we've closed up 12 consecutive Mondays. Aside from Monday, the win ratio for all other days is below average.
20231001-DoW.png

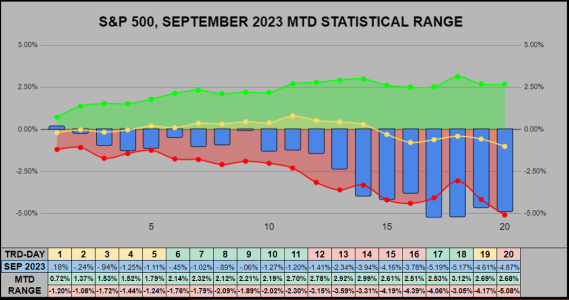
The Oct Monthly stats are posted in the blog, but I did forget to post September's MTD results based on the MTD historical range The results posted below show we closed the month down strong (when compared to the previous 21-years. October's MTD range chart was posted a few days ago, I'll post updates every 5 trading days.
20231001-SEP-MTD.png


Good morning

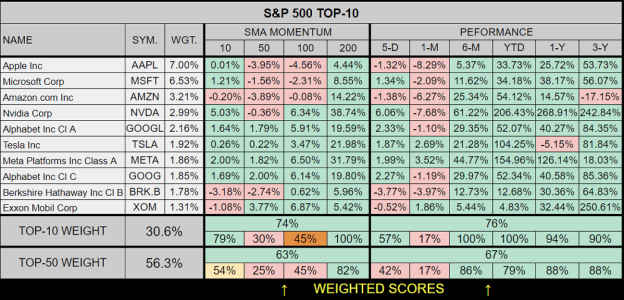
While September wasn't a great month, (within the long-term perspective) the damage has been minimal. In the short-term, 33 of the Top-50 closed below their 10-SMA, while 38 closed below their 50-SMA. As per the usual this year, the majority of the S&P 500's performance has been lifted by the large caps, partially the Top-10 which currently make up a weighted 30.6% of the S&P 500.
20231003-TOP10.png


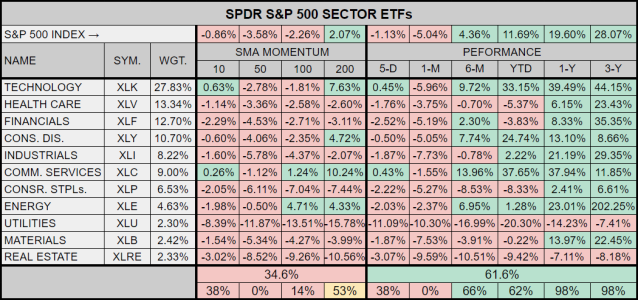
For the Sectors, we can see where the real damage is, and how this is not what a healthy market should look like. We are running on 3 of 11 cylinders. While the S&P 500 is up 11.69% YTD. If we were to remove the Technology, Discretionary & Comm Services, the Index would be up down -2%
20231003-SPDR.png
 
Good morning

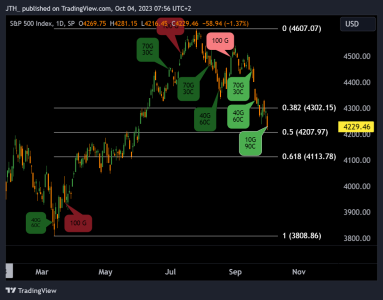
I'm now 3 IFTs into the pullback. Currently watching to see if we can tag that 50% retracement of the yearly high/low. Anything below this 4207.97 level might entice me to throw in the last 10% into the C-fund with a 2nd IFT and thus be fully committed.
20231004-001.png

Admittedly, I've been light on risk this year (too light) but now that we've entered the 4th quarter, I look forward to taking on more risk. Outside of the TSP paper-trading, I'm 40% cash and increasing risk as we progress further into this pullback.
20231004-002.png
 
Good morning

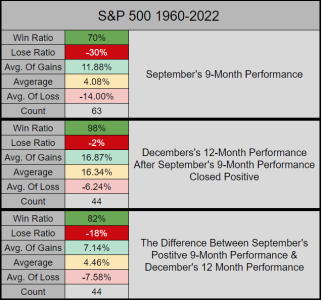
September 2023’s 9-Month performance was 11.68%

Based on history, September’s 9-Month performance data suggest a 98% chance of closing 2023 positive, and an 81% chance of closing 2023 above September’s 4288 close.
20231005-001.png
 
Happy Friday

On the Daily timeframe going back 21-years, we can see the first 9 trading days of October have mixed win ratios. Perhaps next week we’ll find a bottom, then kick it up as we enter trading day 10 on 13-Oct which has historically seen the beginning of an 8-day patch of green.
20231006-001.png

I'll post the 4th quarter blog on Sunday, have a great weekend!
 
Back
Top