JTH's Account Talk

Good morning

Some thoughts on Crypto. I entered the space in Mar-21 and caught a significant climb to the top, wisely keeping the crypto accounts to less than 10% of the overall portfolio. Much of these gains were fed into the stock market, so when prices were rising, life was good. While the 24/7 ability to trade was nice, I did get suckered into the crypto-interest hype, 15K evaporated when the Ponzi-scheme Celsius folded. Anyways, I'll be liquidating the rest of my BTC/ETH holdings and leaving the crypto space this year.

Aside from the continuous lack of regulation and scammer pollution, the biggest issue I had with Crypto was managing the taxes. Across those 3700+ transactions, it was difficult to accurately convert your trades into USD value across multiple trading platforms, it was a huge stressful hassle. You can pay a service to manage your trades for tax purposes, but it's easy for them to screw it up, and it often involves your own personal intervention to correct the data.

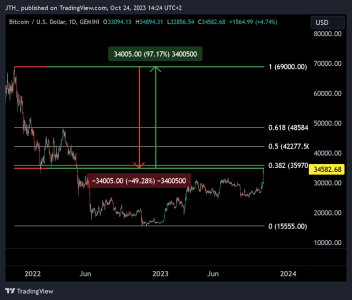
Since Bitcoin is in the news, I'll point out it's down about -50% from the highs, and needs to regain another 97% to regain what it's lost.
BTC.png
 
Good call!

Thanks Tom, I'm glad to see this 50% retracement materialize in October. Things are a bit overpriced and not reflective of the true value, I don't necessarily want a crash, but if we can't prune this stuff back, we might just kill the whole tree. :notrust:

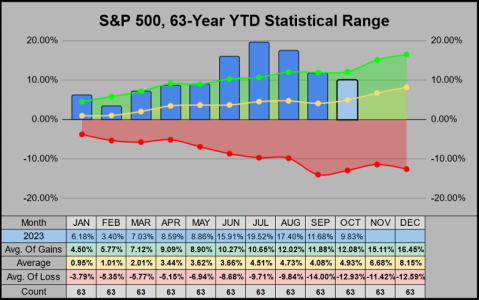
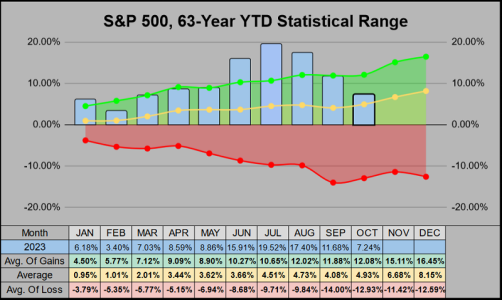
For some perspective, I drafted this chart, showing the 63-Year YTD percentage range on our Monthly closing prices. It shows just how overvalued we were back in July, and how we are still slightly overvalued in October MTD. Honestly despite the recent concerning news, I'm a bit more focused on what will happen in November if we cant get a budget passed...

20231024-YTD.png
 
Re: Sunday

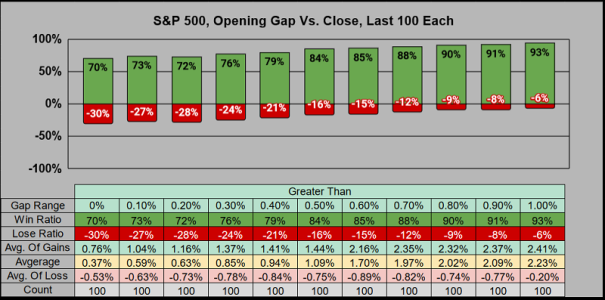
This morning the S&P 500 gaped up .50% at the open.

The last 100 times we gaped up the win ratio on the close was pretty good.
20231024-GAPS.png

 
Re: Sunday

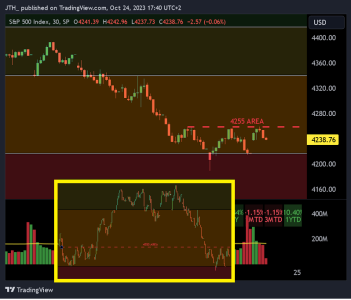
S&P 500 30-Minute chart showing some resistance in the 4255 area, we had a similar pocket of resistance in early October.

4255.png
 
Re: I want my -10% correction!

Good morning

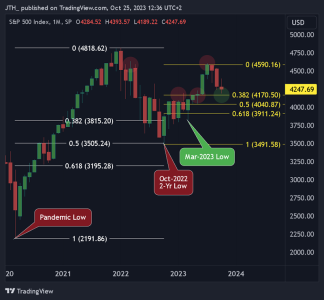
Since we have now re-visited SPX 4203 (a 50% retracement of 2023's yearly low/high) I thought It would be a good time to look for the next significant low.

October 2022 was a 50% retracement from the Mar-2020 Pandemic Low to the Jan-2022 Market peak. This makes SPX 4040.87 a 50% retracement of the Oct-2022 low to the most recent Jul-2023 highs. If you'll notice on this monthly chart, we have not had 3 consecutive down months since coming off the pandemic lows. If this October closes down, it will be the 3rd down month...

20231025-001.png
 
Re: Daily Gaps

Good morning

From 1960 to 2022 (63-Years) October closed down 38% of the time (24 times). When October closed down, November closed up 71% of the time (17 of 24 times). Of those 24 times October closed down, the best was the Oct/Nov combo of 2020 with a -2.77% loss in Oct and 10.75% gain in November.

While being down -2.36% MTD hasn’t been good, it could always be worse. Here’s some examples of some horrible Oct/Nov combos.


1929 lost -30.64% (Followed by the Great Depression)


1973 lost -11.52% (Part of the oil embargo, max drawdown of -49.93%)


1987 lost -30.29% (Black Monday, took 20 Months to recover the Oct/Nov drop)


2008 lost -24.43% (Financial crisis, max drawdown of -57.69%)

 
IFT 100 C-Fund EoB Today (throwing in the last of the 10% G-Fund)

Sry the pic is so big, it's hard to cram in all that data.
20231025-001.png
 
I considered it. Was looking at an entry closer to 4120.

Well, perhaps I could be so lucky as to snag that level today, we'll see.

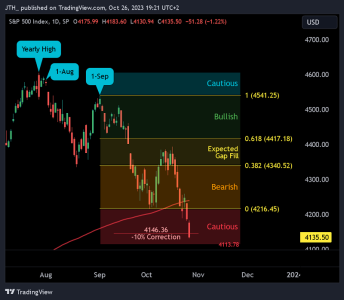
Thus far, we've now breached 4146.36 which meets the technical definition of a -10% Correction from the top.

20231025-002.png
 
Correction

Good morning

"The general definition of a market correction is a market decline that is more than 10%, but less than 20%"

Perhaps the more important thing to consider, 4 major indexes are in “correction” from the previous Jul-2023 top. The first to enter this -10% correction was our Russell 2000 on 21-Sep (the day of the gap). More concerning, it has nearly retraced back to the Oct-2022 low. The following day 22-Sep the Transports breached -10%. This Thursday, both the NASDAQ 100 & S&P 500 have breached -10%
20231027-001.png

Because those 4 major indexes can run in unison or independently from each other for long periods of time (for the Topic of TSP) I'll focus on the S&P 500's (C-Fund).

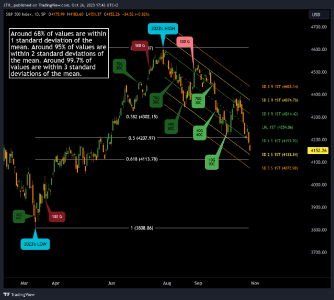
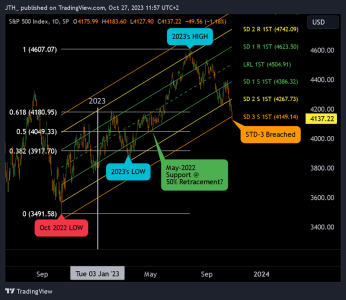
261 sessions takes us back to the October 2022 low which should be seen as a key 3-Year low (going back to Nov-2020). On this timeframe Standard Deviation 3 resides at SPX 4149.14 (where 99.5% of values are expected to to stay within this deviation (on this timeframe)).

On this Fibonacci timeframe, we’ve breached the .618% level, which is fairly common. The next lower level to watch would be a 50% retracement which would take us down to 4049 (an area of previous support in May-2022).
20231027-002.png

For myself (within TSP) I'll fade the rallies. Outside of TSP, my portfolios are designed to be 15% cash at a -20% pullback so I still have some more risk to put on (I'm currently 31% cash). Have a great Friday, next week starts a new Month...
 
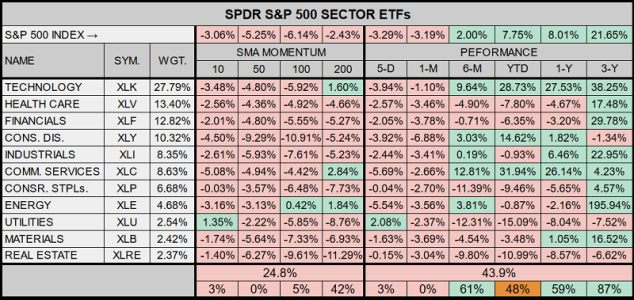
Aside from the previous post, I found it interesting that yesterday 3 of the 11 SPDR Sectors closed up, and they also happen to be the smallest of the 11 sectors by market cap.

Utilities, Materials, & Real Estate, 3 sectors I've largely avoided because all 3 are under their 200 & 500 SMAs.
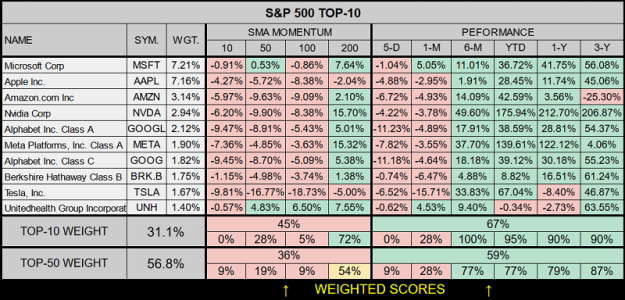
7.89% of the S&P 500's 8.01% YTD gains are from Tech...
20231027-1.png

Meanwhile YTD 17% of the S&P 500's gains are from the Top 9, & 19% from the Top-50
20231027-2.png
 
Good morning

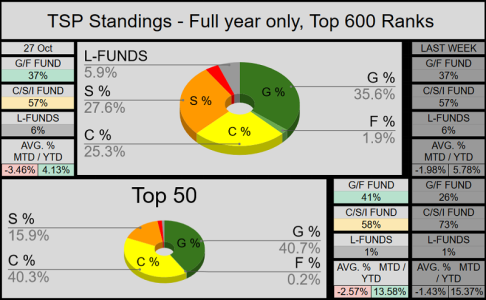
With two trading sessions left for October, it’s been a tough week on the Autotracker. The Top-600 is down -3.46% MTD and even the Top-50 is down -2.57% MTD. Allocation wise, little has changed for the Top-600 while the Top-50 saw a 15% increase into the G/F Funds.
20231029-AT.png

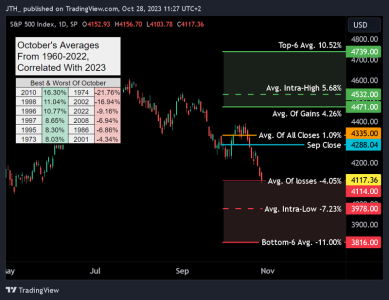
For the S&P 500, at the moment (from a historically correlated viewpoint) on Friday we breached below the -4.05% level (the average-of-losses). We are now down -3.98% MTD. This puts us within striking distance of the 63-Year’s 6th worst October back in 2001 at -4.34%.
20231029-MTD-C.png

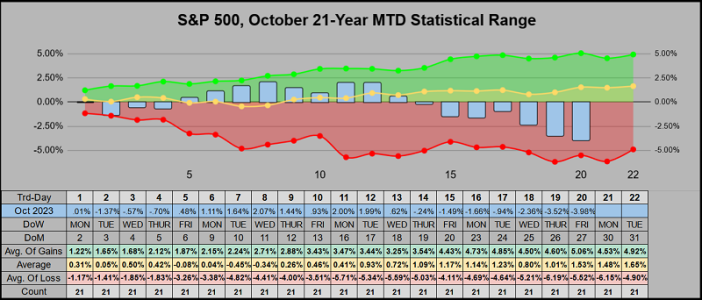
We’ve finished trading day 20 on the MTD Statistical Range chart. From the previous 21-Years, Trading Day 20's MTD was down 7 times, and closed the Month down all 7 times with an average of -3.43%
20231029-MTD.png

From the 63-year YTD Statistical Range chart we are currently 7.24% YTD. This puts us under the 8.15% yearly closing average, but above the target for October's YTD 4.93% closing average.
20231029-YTD.png

In Europe, most of us set out clocks back an hour, I look forward to the US catching up with us next Sunday. Have a great week :)
 
Monday

Good morning

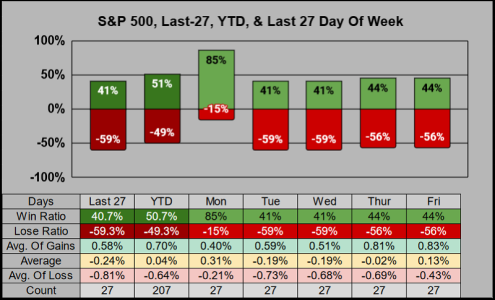
It’s been a rough patch with the last 10 of 12 days closing down. Our current 27-Day win ratio is 40.7%. While definitely on the low end, it’s not an extreme condition. Our 15-Monday win-streak has ended, we do still have a strong 85% win ratio, and as per the 2023 theme (Monday is good, all other days of the week are bad).
20231030-1.png

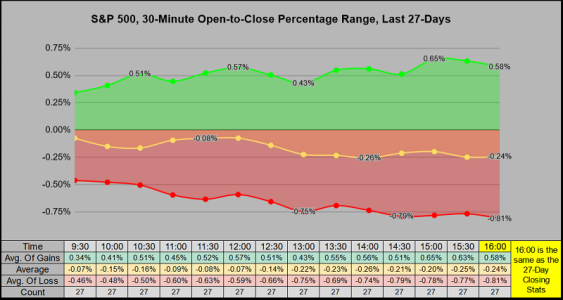
Here are those same 27 days broken down into 30-minute progressive increments. We can see there’s a small peak at 12:00 (past the IFT-Deadline) and then a dip at 13:00. From there, the day tends to progress in the direction of the trend which lately has mostly been down.
20231030-2.png

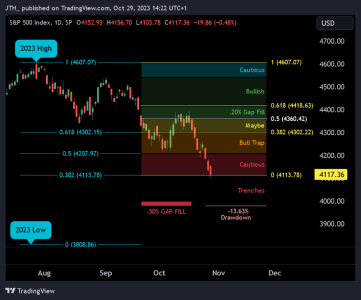
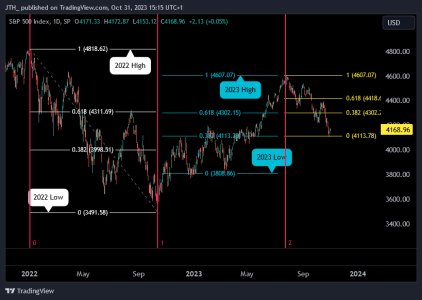
Last week saw a fresh set of new lows, so I’ve redrawn the most recent Fibonacci levels (in yellow) and matched them up with 2023’s Low/High Fibonacci levels (in blue). Technically it’s still a Bull-Market-Correction, but with currently 2 clearly defined lower swing lows & 2-3 lower swing highs, I’m putting myself in the “fade the rally” camp. Should we go lower (a Bear Market of -20%) we would need to go below the March-2023 low (anything is possible) but I’m more inclined to look for a gap fill at 3980.
20231030-3.png

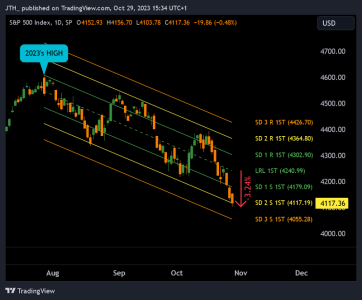
Within the context of a downtrend, this is a fairly orderly descending 66-Day channel. From the 2023 High to our current low, Linear Regression says 4240.99 is “Fair Value & declining” which is only -3.24% off the current low.
20231030-4.png

Once October has closed, I'll draft up a blog with November's seasonal stats, take care.
 
SPX FIB @ 4300

Good morning

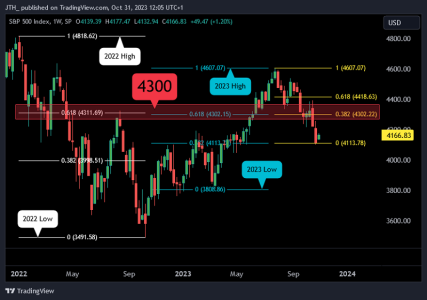
Here’s some speculation, I wonder what will happen in the SPX 4300 area? We have 3 Fibonacci zones which tie together the area of 4302-4312.

Jan-2022 High to Oct-2022 Low with 61.8% @ 4311.69
Mar-2023 Low to Jul-2023 High with 61.8% @ 4302.15
Jul-2023 High to our current low with 38.2% @ 4302.22

20231031-1.png
 
Re: SPX FIB @ 4300

We have 3 Fibonacci zones which tie together the area of 4302-4312.

Good stuff JTH ! ! !
I'm laughing at myself right now because I literally had to Google what the heck a Fibonacci Zone is.........
:lmao::lmao::lmao:
I'm in no way even remotely qualified to be a chart person
:embarrest:, but if anyone else is curious (it's probably just me...) here's a couple links for further info:
https://www.investopedia.com/terms/...acci time zones are a,high, low, or reversal.
https://www.investopedia.com/terms/f/fibonaccilines.asp

..
 
Re: SPX FIB @ 4300


Good stuff JTH ! ! !
I'm laughing at myself right now because I literally had to Google what the heck a Fibonacci Zone is.........
:lmao::lmao::lmao:
I'm in no way even remotely qualified to be a chart person
:embarrest:, but if anyone else is curious (it's probably just me...) here's a couple links for further info:
https://www.investopedia.com/terms/...acci time zones are a,high, low, or reversal.
https://www.investopedia.com/terms/f/fibonaccilines.asp

..

Thanks Epic, I should clarify myself (I forgot about Fibonacci Time Zones). In this case I was using Fibonacci based on price levels (not time). Time-based Fibonacci is a bit outside my wheel house, but sometimes it can pull up some interesting observations. Here is a Fibonacci Time Zone in Red, drawn from the 2022 High to Low, which nicely correlates in Zone 2 with our 2023 Top :D

I should note I don't think the default settings on this are correct....

20231031-2.png


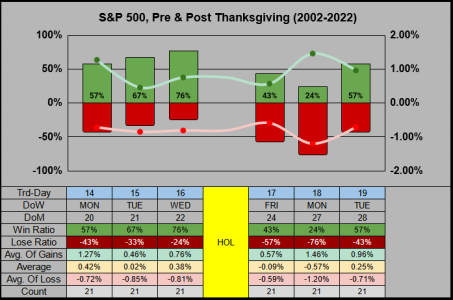
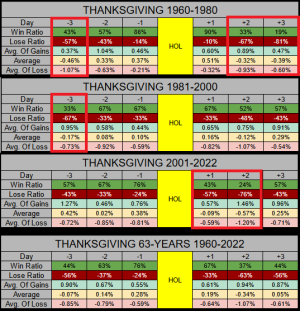
Observation: From the previous 21 years, the Monday after Thanksgiving has a 24% win ratio. Six of those post-Thanksgiving Mondays reside in December. One of those Mondays was Dec 1st 2008, losing -8.93%. It was the single worst day of December and the 4th worst day across 21 years (5,287 sessions).

BLOG: STATS FOR NOV

202311.07-NOV.png
 
I'm surprised to see the Friday after Thanksgiving is up less than half the time.

Thanks Tom

It’s a bit of a mixed bag (for the data I have) things don’t get consistent until 1986. The Monday prior to Thanksgiving 1963 the Market was closed for JFK’s Funeral. So in this case day -3 (three days prior) starts on a Friday. Adding to this, from 1982-1985 on Thanksgiving the markets were open (I have no idea why).

Breaking down Thanksgiving into 21-year increments we can see the post Thanksgiving Friday has gotten weaker over the years, stepping down from 90% to 67% to 43%. My speculation would be that on the daily timeframe, the last 21-years are more reflective of online trading.

My other theory... In the old days folks were too hung over on Friday to go into the office…
Thanksgiving.png
 
Back
Top