JTH
TSP Legend
- Reaction score
- 1,158
1 Nov Stats
Good morning
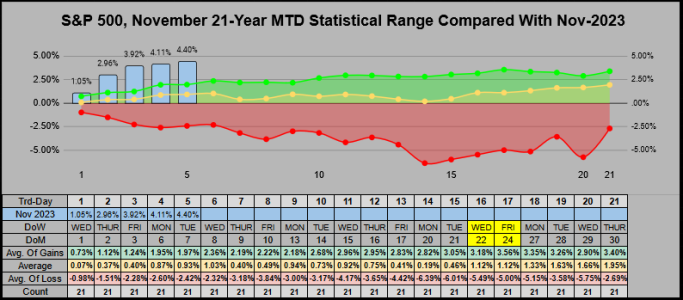
For the S&P 500, our 1st day of November closed up 1.05%
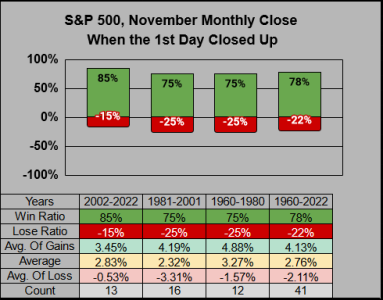
In the far right column, from 1960-2022, the 1st day of November closed up 41 of 63 times. When the 1st day of November closed up, the month of November closed up 32 of 41 times, giving us a 78% win ratio.
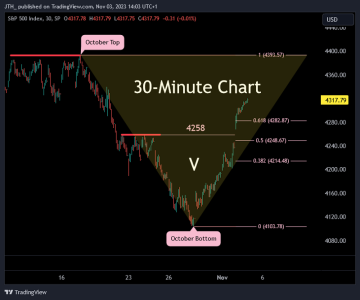
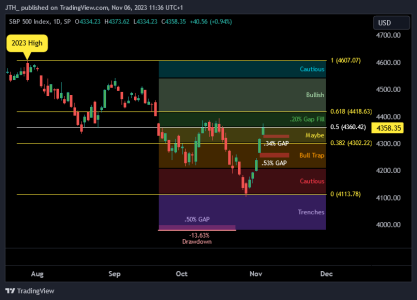
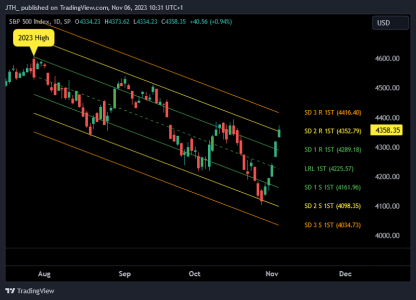
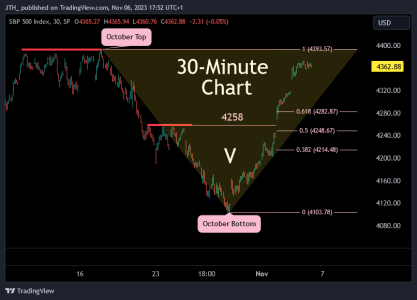
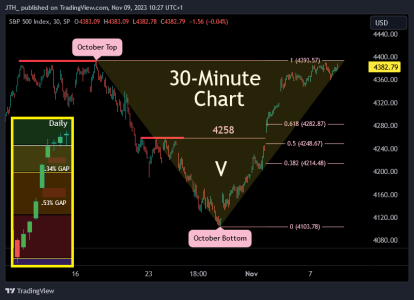
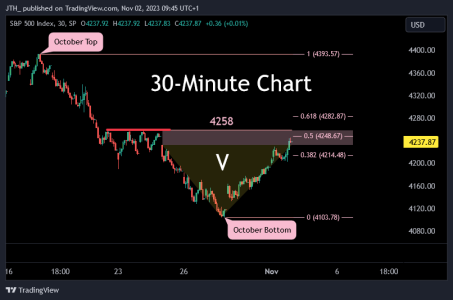
On the 30-Minute chart, spanning across the past 12 days, we can see a potential V-Bottom beginning to take shape. We have nearly re-captured 50% of October's high & low range, we can see 3 areas of overhead resistance at 4258.
Good morning
For the S&P 500, our 1st day of November closed up 1.05%
In the far right column, from 1960-2022, the 1st day of November closed up 41 of 63 times. When the 1st day of November closed up, the month of November closed up 32 of 41 times, giving us a 78% win ratio.

On the 30-Minute chart, spanning across the past 12 days, we can see a potential V-Bottom beginning to take shape. We have nearly re-captured 50% of October's high & low range, we can see 3 areas of overhead resistance at 4258.


