JTH's Account Talk

Tuesday

Good morning

Seasonally speaking, the beginning of December starts off weak.

From 63 years, When the last day of November closed up, the 1st Day of Dec closed up 37% of the time. If the last day of November closed down, then the 1st day of Dec closed up 52% of the time.

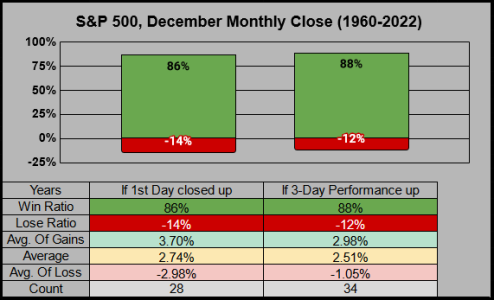
But when the 1st Day of Dec closed up, the Month closed up 86% of the time, and when the 3-Day performance was up, the month closed up 88% of the time.
2023-11-30-1.png
 
Wednesday

Good morning


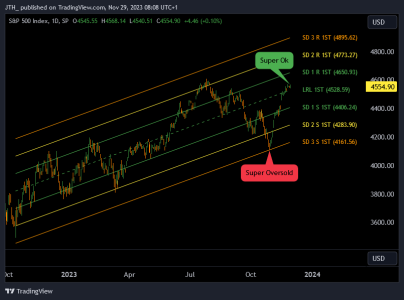
This beautiful linear regression channel which goes back 284 sessions to the Oct-2022 low shows us two things I find interesting.

The first being just how oversold we were this October. Even if we backtrack to those 279 sessions, we had still pierced standard deviation 3 on Oct-23rd. Equally impressive is how current prices are now sitting in the pocket (neither oversold nor overbought) on this timeframe.

2023119-6.png

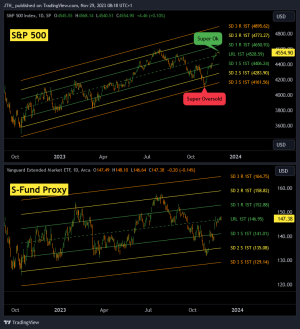
In a direct comparison with VXF, we can see this ETF did not touch standard deviation 3. While it did lose more percentage performance, it did not lose more strength (on this timeframe). The same holds true for the Wilshire 4500 & the Russell 2K (although the R2k channel is slightly declining).
2023119-7.png

 
Thursday

Good morning

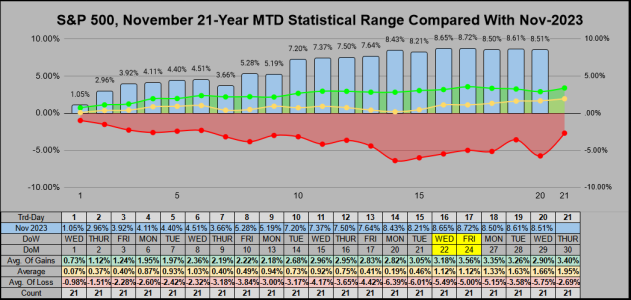
Going back 63 years to 1960, this month has potential to be the 4th best November on record. For our 20th trading session we are currently up 8.51% MTD.
20231130-1.png

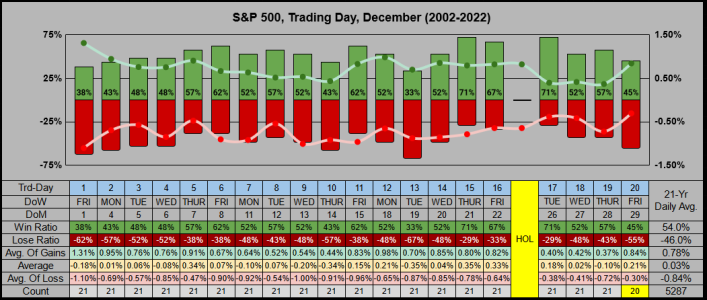
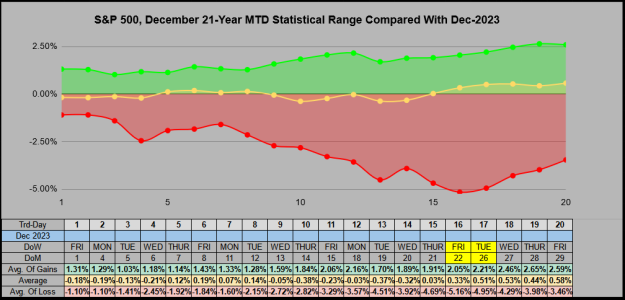
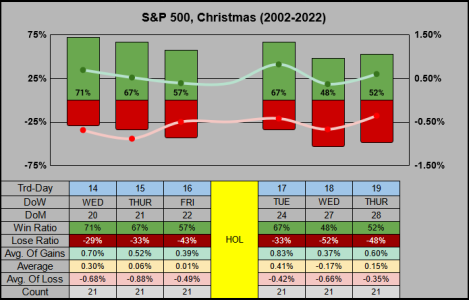
Looking ahead to December (seasonally speaking) from the previous 21 years it's started off with some weakness across the first 4 sessions. Typically, this month has a good closing win ratio, as we begin to close out the year we'll see if seasonality holds true.
20231130-2.png

The December MTD chart shows a peak around 18-Dec and again on 28-Dec, with the declining trough on 22-Dec.
20231130-3.png
 
Re: Sunday

Looks like December we will be rolling the dice again. It will be nice to finish November on the positives side. First time in three months and only the fifth time this year.

fingers crossed.jpg
 
Sunday

Good morning

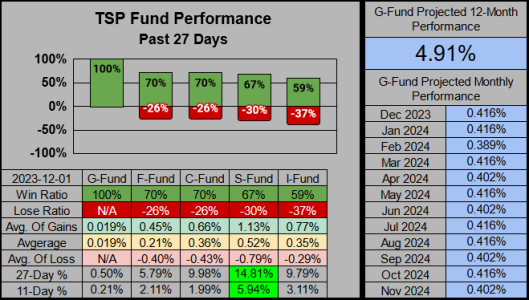
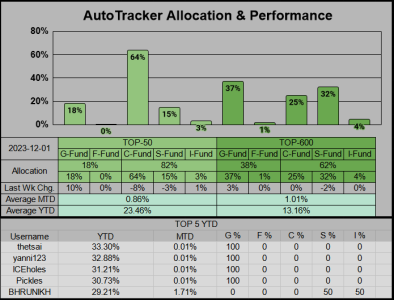
Our TSP Fund performance across the past 27 sessions is stellar. The S-Fund has the highest gains racking in 14.81% over the past 27 days & 5.94% over the past 11.
20231201-1.png

Allocation wise, the Top-50 decreased their C/S holdings by 11% and increased their G-fund holdings by 10%. Of the Top-5, four are “risk off” with 100% G-Fund. Sitting in 5th place is BHRUNIKH, with 50/50 in S/I and perhaps poised to take the lead (should we rally further).
20231201-2.png

 
Monday

Good morning

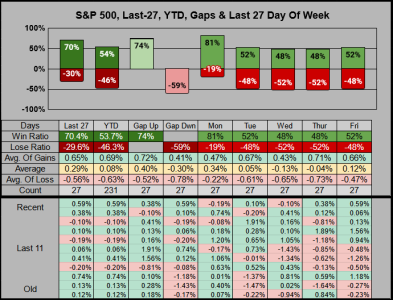
On the Day of Week Chart the 27-Day win ratio has increased to a 70.4% win ratio. This is the strongest reading on file since 24-Nov-2021. This happens to be 27-sessions before the S&P 500’s all time high on 04-Jan-2022. Of the past 5,519 sessions (almost 22 years) only 275 sessions had a 27-Day win ratio = or > 70%.

Our Gap-Down vs. the close has dipped to -59% so (as of late) buying on a gap-down day has become less reliable. Our last 5-Fridays have closed up.
20231204-1.png

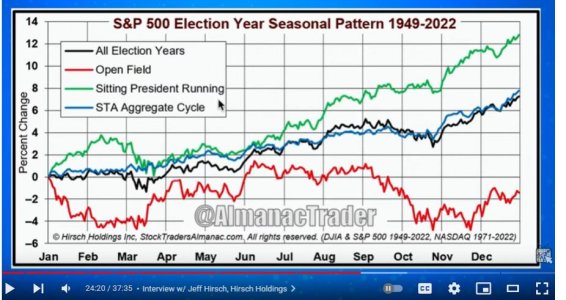
20:00 Interview w/ Jeff Hirsch, Hirsch Holdings of The Stock Trader’s Almanac: The green line represents a sitting President in the 4th year of the Presidential Cycle. “Just watch out for early December; it tends to be flat with tax loss selling and portfolio restructuring”.

Screen Shot
20231201-6.jpg

 
Re: Monday

The three major indices all made all-time highs within a couple months of each other in the general time frame.

So true, in hindsight it should have been easy to spot.

ARK Innovation fund folded in Feb-21, Crypto/Transports/Small Caps in in Nov-21, all the speculative money dried up first, the S&P 500 was the last to roll over.
 
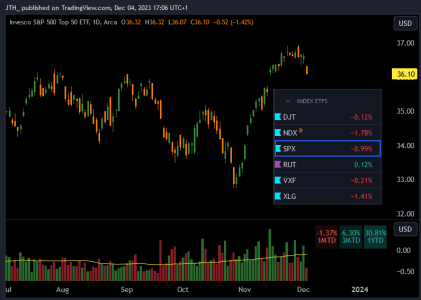
Given that SPX is down -1% I figured I'd check on the Top-50 (sure enough) it's down -1.4%

20231204-3.png


Re: Tuesday

Good morning

Thought it might be good to revisit older posts.


Good morning

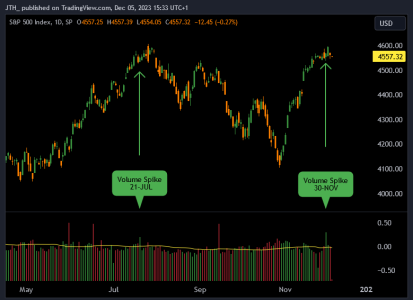
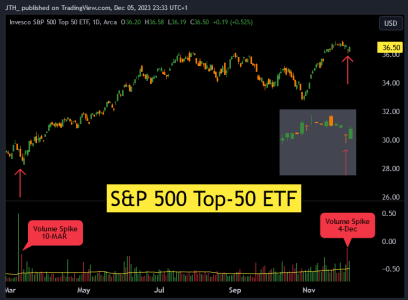
Sometimes spikes in positive volume can be a precursor to a top.

Sometimes spikes in negative volume can be a precursor to a bottom.The S&P 500’s Weighted Top-50 roughly has a 57% weighting on the S&P 500 so it can really move the needle.
20231206-1.png

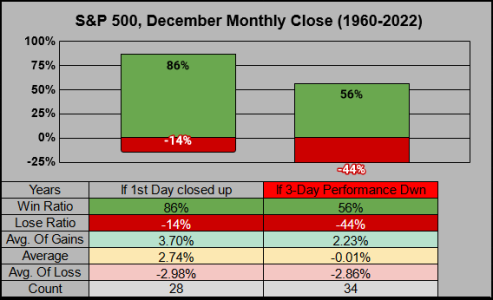
Seasonally speaking, the beginning of December starts off weak.

From 63 years, When the last day of November closed up, the 1st Day of Dec closed up 37% of the time. If the last day of November closed down, then the 1st day of Dec closed up 52% of the time.

But when the 1st Day of Dec closed up, the Month closed up 86% of the time, and when the 3-Day performance was up, the month closed up 88% of the time.

December’s 3-day performance is -.01% so the 88% end of month win ratio falls to 56%
20231206-2.png

 
Re: Tuesday


Sometimes spikes in negative volume can be a precursor to a bottom.The S&P 500’s Weighted Top-50 roughly has a 57% weighting on the S&P 500 so it can really move the needle.

Interesting. I don't see that spike on any other chart.
 
Re: Tuesday

Interesting. I don't see that spike on any other chart.

Yea volume for me is a tough indicator to follow. There are similar candlestick patterns in MSFT/XLK but XLG is less than 3Billion, so perhaps easy to push around.
 
Re: Monday

Good morning

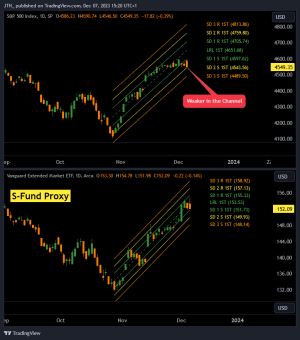
Seems like we'll see more of this current 10-day churning grind. We are now 28 days off the 27-Oct bottom. The linear channels show the S&P 500 (upper chart) is weaker of the two. The S-Fund proxy (lower chart) did make a new high, but didn't hold it.
20231207-1.png
 
TGIF

Good morning (more consolidation)

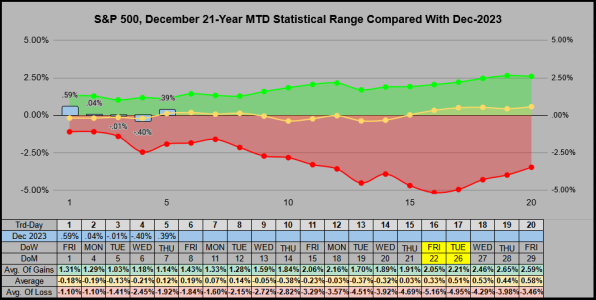
On the MTD Tracker we’ve closed Trading Day-5 at .39% MTD. At this juncture, (from this 21-Year perspective) we have a 79% win ratio. Previously, December’s positive Day-5 closed the month up 11 times for an average 2.93% gain, or closed the month down 3 times for an average -.46% loss.
20231208-1.png

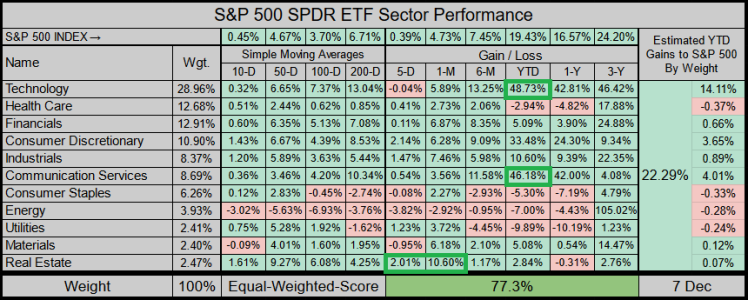
On the Sectors, Tech & Communication Services are nearly neck & neck with 45%+ YTD gains. It also appears buyers are slipping back into Real Estate on the short-term 5/30-day timeframe.
20231208-2.png

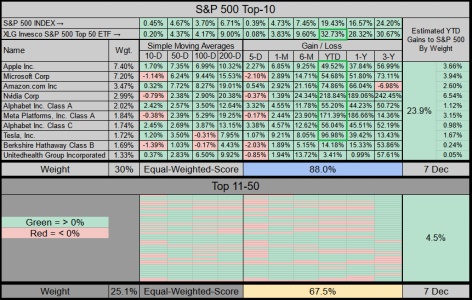
For the S&P 500’s Top-10/50 I’ve added the Top-50 ETF XLG under the S&P 500’s stats. Of note, the YTD performance of the Top-8 is incredible.
20231208-3.png

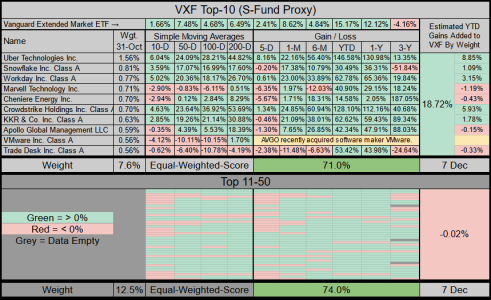
The S-Fund Proxy ETF VXF (truncated to the Top-10/50) looks weaker in the short-term, but still has reasonably healthy readings. Our 9th ranked company VMware was recently acquired by AVGO (a Top-50 S&P 500 company). As of now, Vanguard's last weighting update is from 31-Oct, so I’ll remove VMware when they update their holdings page.
20231208-4.png

Thanks for reading, have a great weekend!
 
Back
Top