JTH's Account Talk

Tuesday

Good morning

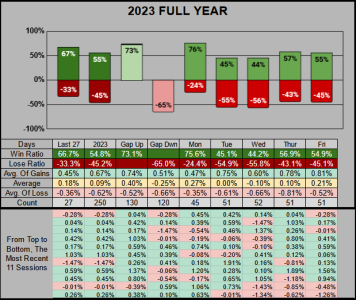
After cranking out 3 blogs and prepping for the new year, I’m ready to get back to the normalcy of trading. Here’s the finalized results for 2023. Our daily win ratio across 250 sessions was 54.8% with an average gain of .09%. Perhaps the usual in a bull market, the opening gaps up (leading to a positive close) was stronger than the gaps down (leading to a negative close). And of course there was our marvelous Monday with a 75.6% win ratio, contributing the most gains to the S&P 500 with 12.01%.

Tuesday gave us a flat .17%
Wednesday sunk us by -5.39%
Thursday gave us 5.03%
Friday gifted us 10.03%

From this perspective, nearly all of 2023's gains came from Monday & Friday.
20240101-1.png

___
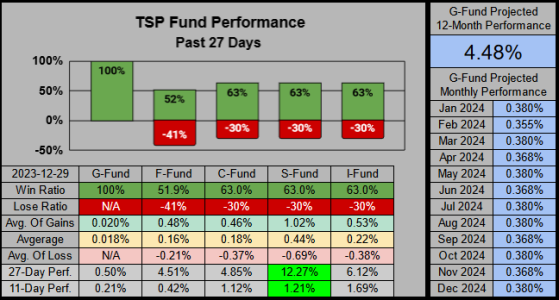
For the TSP Funds, our beloved S-Fund is kicking azz and taking names, but keep an eye on the I-Fund, which is outperforming on the 1-10 day timeframe.
20240101-2.png

___
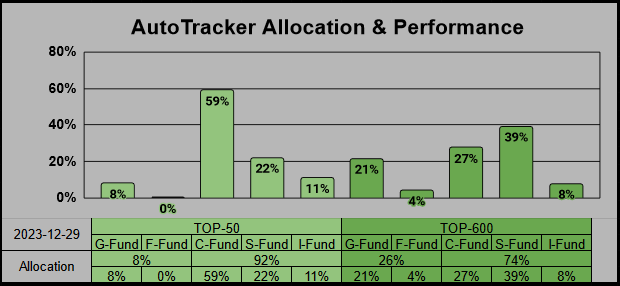
Kicking off a fresh 2024, it looks like the majority of Tracker participants have decided to go “Risk On” with the C/S funds. The F-Fund gets no love, but for 2023 it did earn 5.58% outperforming the G-Funds’s 4.22%
20240101-3.png

___
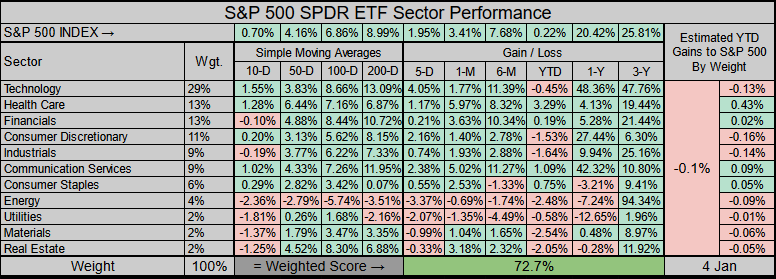
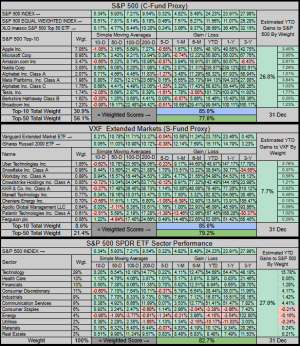
Here’s a consolidated view of the S&P 500, the Extended Markets, and the Sectors. From these numbers, I would gauge we are somewhat overbought, but not in an extreme condition (the 85-100% range). I'll have to work on the chart size (it's a bit too small).
20240101-6.png

Have a great week!
 
Report Card

Report Card Time

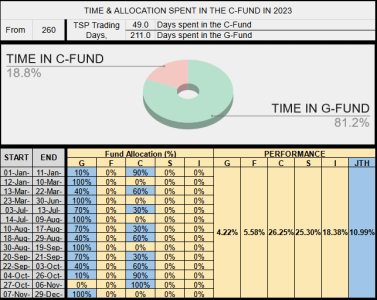
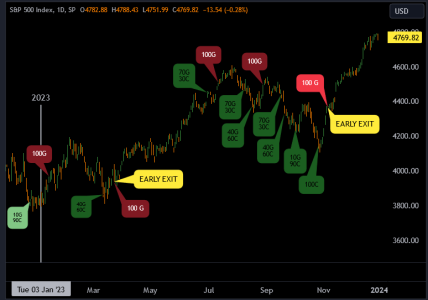
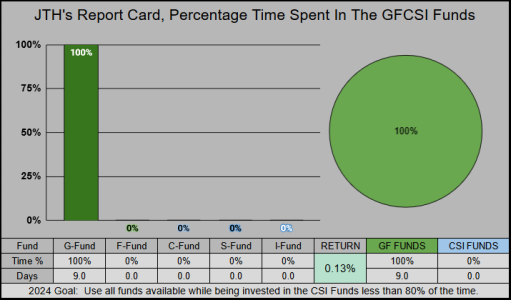
For myself, I finished the year in the G-Fund, earning 10.99% with 13 IFTs. For 2023, I had chosen a strategy of being invested in the C-Fund less than 50% of the time, while outperforming the C-Fund and it turns out it was a difficult strategy to implement.

There were two specific missteps on my part. I sat out a portion of the two biggest rallies of the year (waiting for a pullback that never materialized). So for 2024 I’ll take on more risk and not concern myself with having to get the lower entry. While I would like to be invested less than 50% of the time (for a bull market) I think this is an unrealistic objective.

For 2024, my goal will be to choose from all funds available, and to be invested in CSI less than 80% of the time.
20240101-4.png

20240101-5.png
 
Re: Wednesday

Good morning

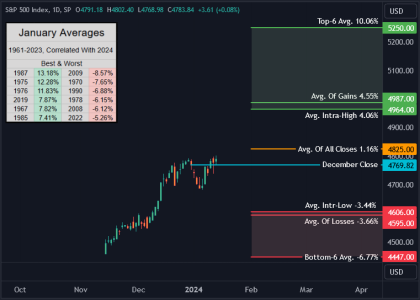
Today is officially the last day of the Santa Claus Rally where all eyes should be on SPX 4746.76 (we are currently below). We need to close above this level to keep seasonal statistics in our favor. From 1961, a failed Santa Claus Rally dropped the yearly win ratio from 73% to 64%.

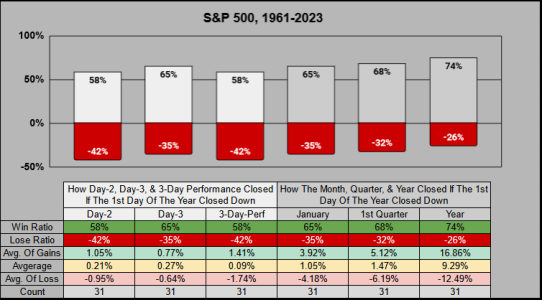
When the 1st day of January closed down…..Here’s the results for the 2nd & 3rd Day of January, the 3-day performance, the month of January, the 1st Quarter and the year.
20230103-1.png
 
Re: Wednesday

Not looking good but its early. :sick:

Nope, the odds of it happening are slim.

We have a -.37% gap down on the open and need a .46% close.

Across 15,889 sessions, the markets have gaped down 945 times ≤ -.25%

From this, the S&P 500 closed up 62 times .46%

So there's about a .006% chance.... :D
 
Thursday

Good morning

While some of these statistics may seem negative, from the 2 most recent blogs, I had posted that 55.6% of yearly lows are in the 1st Quarter & 41.3% are in the Month of January. If we were to see a potential pullback/downturn/correction, I personally view it as “healthy market behavior” and welcome buying into a dip.

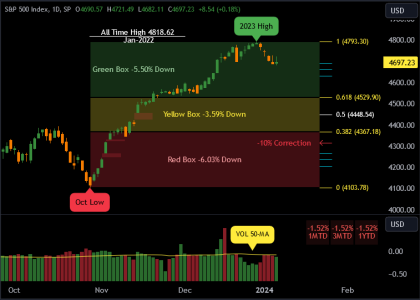
Starting off 2024, seasonal expectations are lower than usual. The first of the three January indicators has closed down and while the Santa Claus Rally has only failed 14 of the past 63 years, it should also be considered we had a substantial 15.67% rally leading into the indicator.

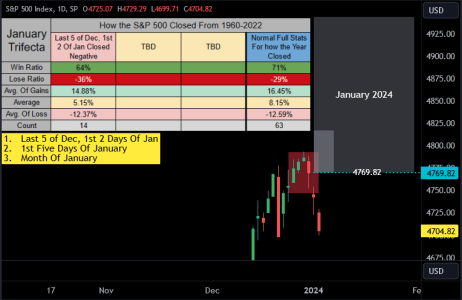
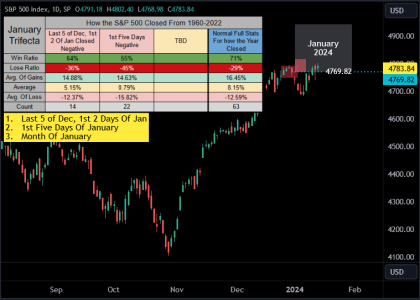
In the Red Box: With Santa taking his gifts back, the end of year win ratio has dropped from 71% to 64% (across this 14-year sample of data). In the meantime we are working on our 2nd indicator (The first 5-Days) which has 3 days to climb back into the small gray box at 4769.82
20240104.png

___
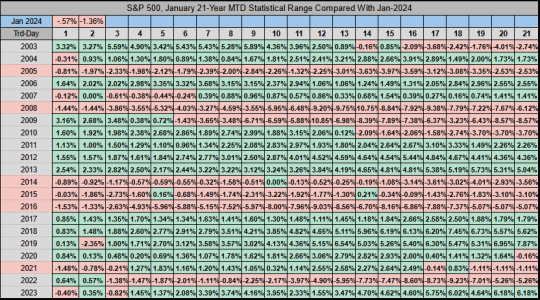
Usually I try to post MTD data every 5 days, but since there’s a small pattern here, I thought I’d share it now. On Day-2 MTD we closed down -1.36%. The chart below is MTD data (not daily returns). From the past 21 years, January Day-2 MTD was down 6 of 21 times. From this, the Month of January closed down all 6 times for an average loss of -3.58%
20240104-1.png

___
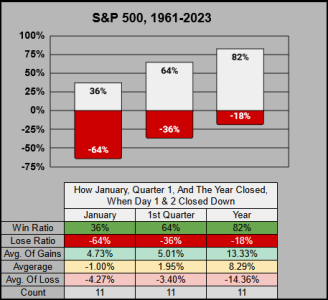
Random Stat: From 1961, both the 1st & 2nd day of January have closed down 11 of 63 times. Here are those 11 results for the Month of January, the 1st Quarter, and the Year. From the stats below we can see over those 11 years, January was a stinker, but Q1 was decent, and the Year was good.
20240104-2.png
 
TGIF

Good morning

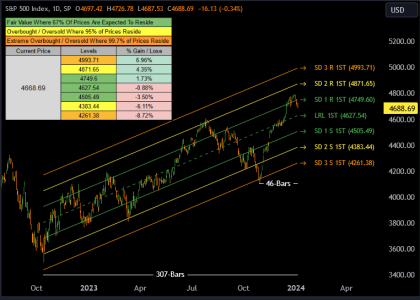
Here’s the long-term Linear Regression channel 307 sessions off the Oct-2022 Bear Market Bottom. From this vantage point we are within the “Fair Value” range. A pullback to the bottom orange channel would cost us -8.72%
20240105-0.png

___
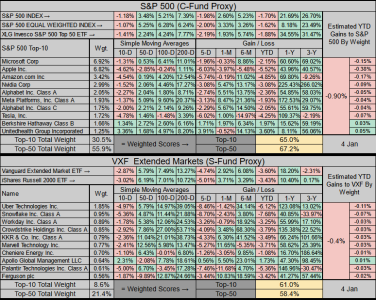
I’m always looking for ways to put more relevant data in less space. For this year, when tracking the S&P 500, VXF, & the Sectors, I’ll keep a log of the equal-weighted scores, so we can see how they progress. As you may have guessed, the scores have dropped across the board.

20240105-1.png

___
Recently Apple was downgraded, this was all the excuse folks needed to take profits. Over the past 5-Days (5-D) Apple, Amazon, & Tesla have taken the biggest hit, losing an estimated -.71% for the Index.


The VXF Extended Markets have also taken a hit, and while they scored weaker than the S&P 500, they are holding up well.
20240105-2.png

___
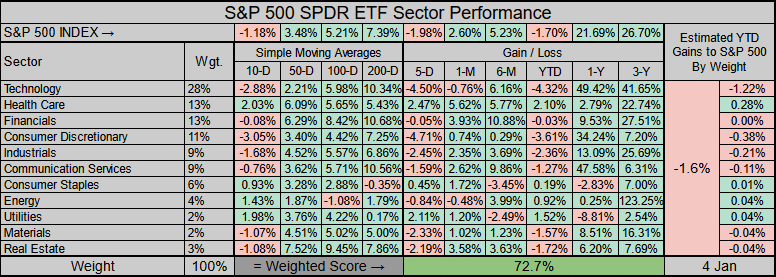
For the Sectors, as we might expect, Technology has taken the largest loss. While last year Health Care stank, It appears it’s now getting a bid. We can also look out for the typical high dividend sectors (Energy, Utilities, Real Estate) which may get a stronger bid this year as we get closer to interest rate cuts.
20240105-3.png

Side note: From the January Blog, across 63-years, 61.9% of yearly lows fall within the months of January, March and October. So if January digs deep & doesn’t recover, we may find a better buying opportunity in March.

Have a great weekend!

 
Sunday

Good Afternoon

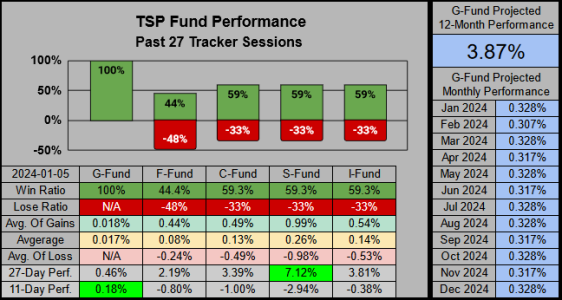
This week the CSI Funds closed with identical win ratios at 59.3%. The S-Fund continues to outperform on the 27-day timeframe, while the G-Fund dominates across the past 3-16 days.
20240107-1.png

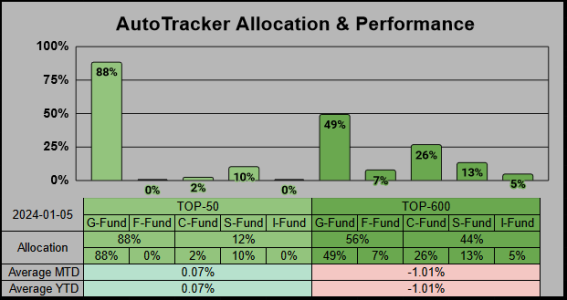
On the AutoTracker The G-Fund currently holds the 6th position, and our Top-600 has pushed an extra 30% into the GF Funds.
20240107-2.png

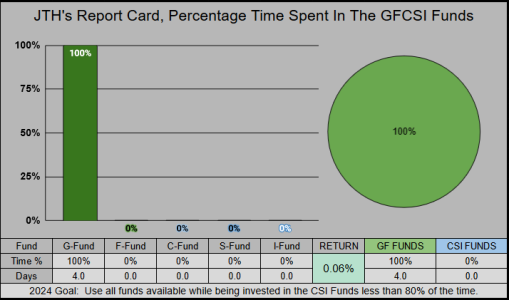
For myself, this is a good time to watch how next week plays out, so for now I’ll stay in the G-Fund.
20240107-3.png

Have a great week!
 
Monday

Good morning

You may have noticed it was lighter volume floating us to the top and although volume on the most recent 5-day -2.32% decline is higher, for most part it's below our 50-day Volume Moving Average. Without high volume providing some form of conviction I might speculate we aren’t in any immediate danger just yet.

20240108-1.png

___
TLDR: Gaps up are stronger, Tue & Fri are strongest, Wed is weakest.

For now, I’d like to focus on the shorter 11-day timeframe.

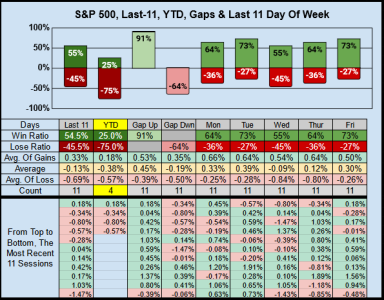
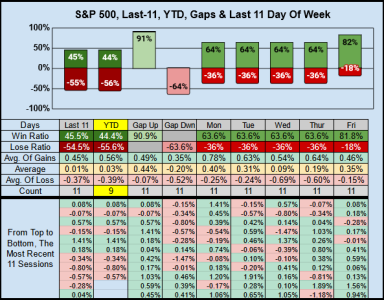
Gaps: Selling at the close when the index gapped up at the open earned 4.91% over the past 11 sessions with a 91% win ratio. Buying at the close when the index gapped down at the open was less reliable but did save -2.12% over the past 11 sessions with a 64% win ratio.

DoW: Tuesday & Friday have an impressive 73% win ratio. For the sum of gains, Tuesday leads the pack earning 4.31%, Friday earned 3.26% while Wednesday lost us -.96%

20240108-2.png
 
Re: Thursday

Good morning

I had zero plans to do a blog, but sometimes I go down a rabbit hole, such is the case with wondering about the correlation between the FCSI funds and how often they trade in the same direction.

Blog: TSP Fund Correlation

___
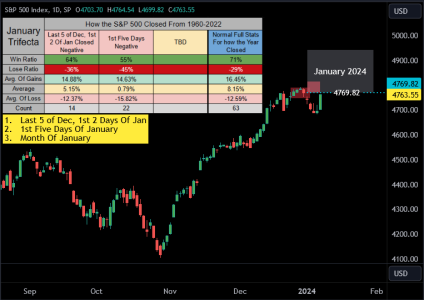
New discussion: While the 1st 5 days of January did make a valiant last-day run it ultimately fell short. Closing below the 2nd red box, our 2nd of three January Trifecta indicators closed negative. This means the first 2 indicators have closed down, thus reducing the statistical win ratios and average returns.


Our last Indicator is the January Barometer, which only needs to close the month up, to put some seasonal statistics in our favor.

20240109-2.png


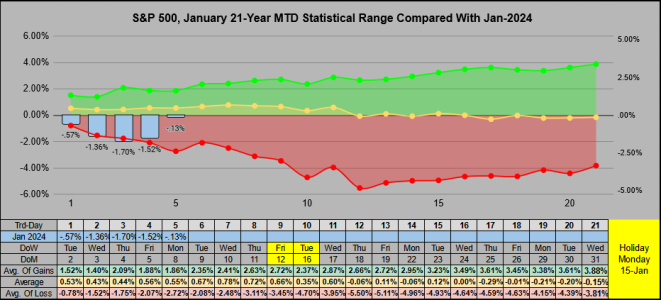
Usually I try to post MTD data every 5 days, but since there’s a small pattern here, I thought I’d share it now. On Day-2 MTD we closed down -1.36%. The chart below is MTD data (not daily returns). From the past 21 years, January Day-2 MTD was down 6 of 21 times. From this, the Month of January closed down all 6 times for an average loss of -3.58%

MTD we’ve closed trading Day-5 down a flat-.13%

From the previous 21 years MTD Trading day-5 was down 5 of 6 times, closing the month positive once for a 1.41% gain, and closing the month down negative 5 times for an average -4.5% loss.

20240109-1.png


Take care… Jason
 
Thursday

Good morning

Next Monday is a Holiday.

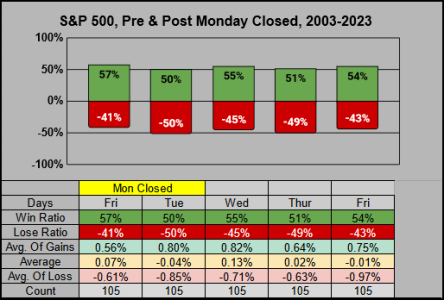
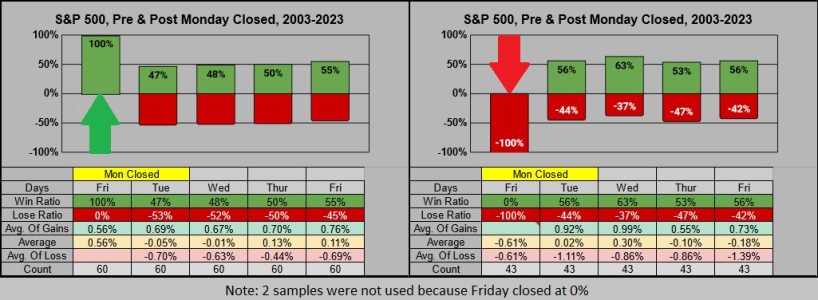
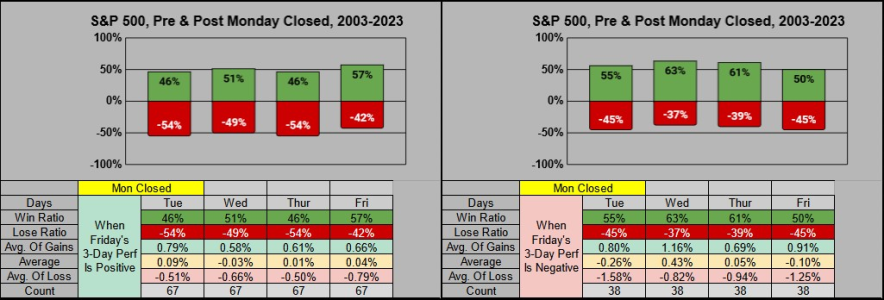
I thought I would look into what happens with the 4-days following a Monday when the markets are closed. This set of data uses a Friday and the next 4 days after a closed Monday, giving us 105 samples from 2003-2023.

TLDR: Potentially... the stronger the Friday (before a closed Monday) the weaker the following Tuesday through Thursday.

Here’s all Fridays with a closed Monday followed by the next 4 days of the week (usually Tue-Thur) across 105 session samples.

2024011-1.png

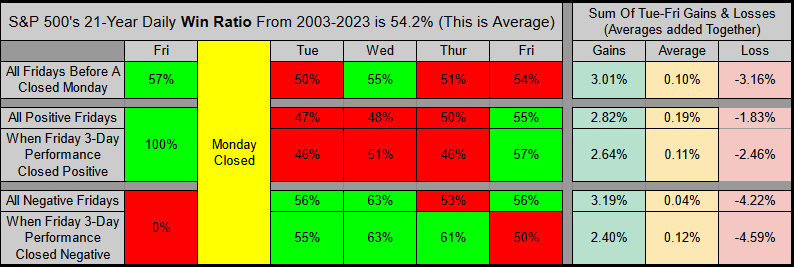
Here’s a comparison when Friday closed up vs. down.

2024011-A.png

Here’s a comparison when Friday’s 3-Day performance was up vs. down. Tue-Thur are daily results (not 3-Day)

2024011-B.png

Finally, here’s an overall summary. For win ratios, It would appear when Friday is positive, then the following Tuesday through Thursday tends to be weaker, but the gains are about the same (when we win), while a negative Friday does lead to higher win ratios, the losses are larger (when we lose).

2024011-0.png

Take care!

 
Last edited:
Friday

Good morning

This week we have higher scores to report, with similar statistics between both the S&P 500 and the VXF Extended Markets.
2024012-1.png

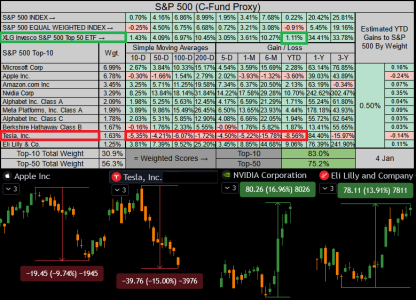
As with most of 2023, it’s the S&P 500’s Top-50 which appears to be carrying the markets. Our Top-50 ETF XLG is up 1.11% YTD.

For the S&P 500, Apple (which makes up nearly 7% of the index) has been off to a rough start, it peaked on 14-Dec, dropping -9.74% and still trying to recover. Tesla Drops to the 9th position, peaking on 28-Dec, losing -15%, Nvidia (the darling of AI) is off to a great start this year and Eli Lilly enters the 10th spot, from 15-Dec rising 13.91%
2024012-2.png

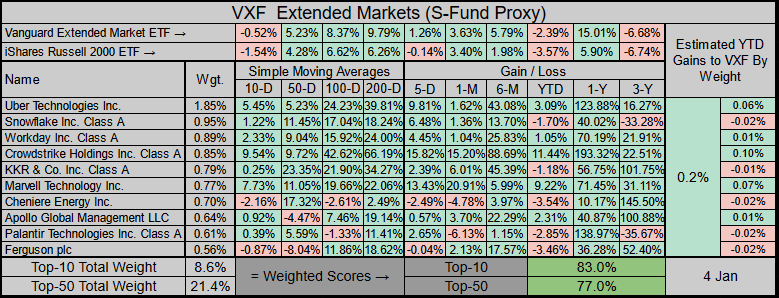
While the extended markets are off to a rough YTD start, the Top-10 is only marginally flat, so from this perspective, they are holding up well. We are still in the season where (during bull runs) we tend to see small caps outperform, so if we get a bid, our S-Fund could benefit more than the C-Fund.
2024012-3.png

For Sector performance, YTD Healthcare is leading the pack, but considering how beaten down it was last year, some form of sector rotation should be expected this year (I hope).
2024012-4.png

 
Sunday

Good Morning

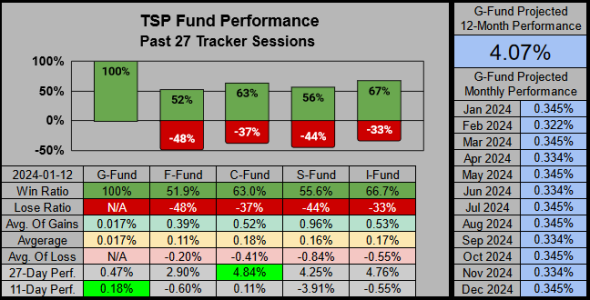
While the S-Fund has been more volatile (winning & losing bigger), our C-Fund continues to be a consistent performer, with the I-Fund nudging its way into 2nd place.

20240114-1.png

___
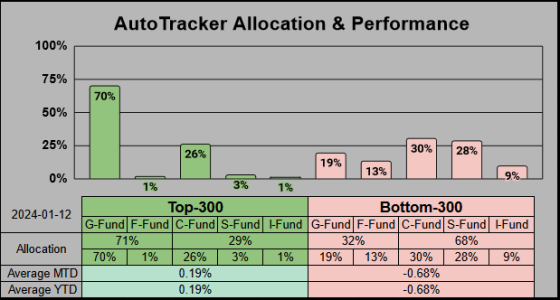
On the AutoTracker, this week it’s the C-Fund holding the 10th position. There’s been little movement for our Top-600 which has pushed an extra 4% from G into the CS Funds.


The chart this week shows the Top & Bottom 300, almost all of the Top-300 are positive YTD, and all of the Bottom-300 are negative YTD. The key difference between the two factions, the Top-300 has 39% more in the GF funds, and the Bottom-300 has 39% more in the CSI Funds with 33% more in the SI funds.

20240114-2.png

___
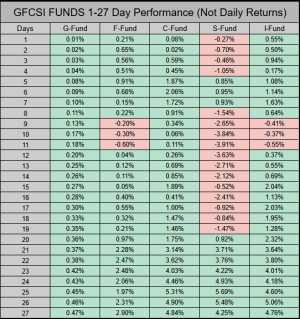
Thus far on the 1-27 day performance timeframe, the S-Fund’s gains aren’t consistent. For now, it’s our C & I Funds which appear as the most profitable.

20240114-3.png

___
For myself, I’ve been waiting to see how our first 2 weeks will play out. If the conditions are ripe, then I plan to IFT this week (most likely into the C-Fund). If I don’t like the conditions, then my plan B is to go into the F-Fund, and wait for a better opportunity to transfer into the C-Fund.

20240114-4.png
 
Re: Wednesday

Good morning

We are just under half-way into the month, & have boringly yet to cross any of our historical percentage lines. There is good news, our most recent 3 closes are positive MTD.

20240115-2.png

___
There’s a minor update to the January Trifecta. As we know it didn’t trigger this year, which historically drops the seasonal yearly win ratios and returns. While the first 2 indicators (and price boxes) failed, we still have our 3rd Indicator “The January Barometer” where prices are now within the 3rd box.

A close within our 3rd box above 4769.82 gives us a positive January, and in theory contributes to a positive outlook for the year, giving us an annual 86% win ratio based on the January barometer alone.

20240115-3.png

___
T
he last 11 Tuesdays go back to 31-Oct, but because of holidays, the last 11 Mondays take us further back to 16-Oct. Interestingly Mon/Tue/Wed/Thur have the same 63.6% 11-day win ratio. The strongest 11-day gainers are Monday at 4.44% & Friday at 3.82%, the weakest is Wednesday at 1.04%.

20240115-4.png

 
Tuesday

In reference to the last Bull Market Peak:

I'm always looking to see who plays follow the leader when it comes to price peaks.

Bonds BND Aug 20
Innovation ARK Feb 21
Crypto BTC APR/Nov 21
Transports DJT Nov 21
NASDAQ 100 NDX Nov 21
Russell 2000 IWM Nov 21

SPX Jan 22 (Last to the party)

Good morning

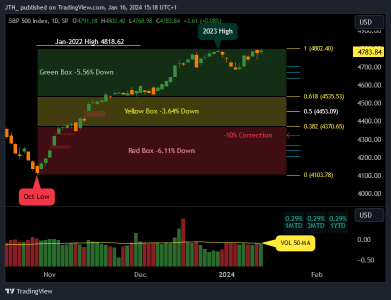
We are just .34% under the S&P 500's all time high, where perhaps sellers have been cashing out near this most recent top. The question is, do we have enough buyers to step in and push us higher? For the chart below, these are the levels I'm watching, while I'd love to see a decent pullback, I don't detect enough fear (just yet). What we need is a hard flush...

20240116-1.png
 
Wenesday

Good morning

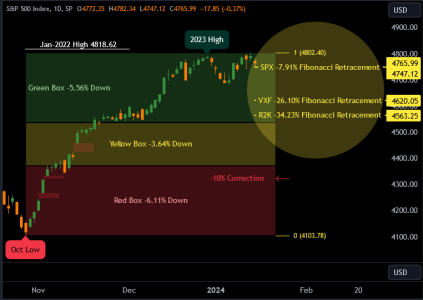
In an attempt to compare apples to apples, I’ve converted Fibonacci into a percentage range, then outlined where VXF & R2K fall within the range of the S&P 500’s prices.

From Tuesday’s Low: The S&P 500 has retraced -7.91% of its Oct/Jan Fibonacci range. By Comparison, the Extended Market ETF VXF has retraced -26.10% of its Fibonacci range, and this is where it would fall within the S&P 500. In addition, the Russel 2K has retraced -34.23%

So basically VXF/R2K are weaker within the Fibonacci range when compared with the S&P 500.

20240117-0.png


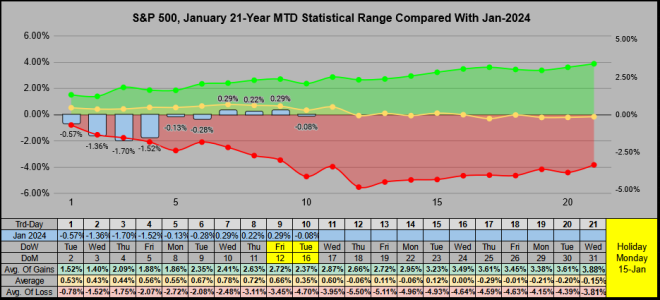
From the previous 21 years MTD Trading day-5 was down 5 of 6 times, closing the month positive once for a 1.41% gain, and closing the month down negative 5 times for an average -4.5% loss.

Trading day-10 closed down -.08%. From the previous 21 years MTD Trading day-10 closed down 6 times, closing the month down all 6 times for an average -5.11% loss.

20240117-1.png

 
Back
Top