JTH's Account Talk

Thursday

Good morning (Important, mark this level 4682.11 )

It was the best of times it was the worst of times, but statistically speaking January was not a volatile month, (although it did switch sides more than once). IMHO (for February) the most important level to watch on the S&P 500 is the Jan 5th Intra-low of 4682.11

Why? Over the past 63-years, Feb breached the Jan Low 24 times, of which 12 times the year closed down. That drops the yearly win ratio from 75% to 50% (across 24 years).

To put it another way, from 63-years (1961-2023), the S&P 500 closed down 16 times, from this 12 of those times Feb breached the Jan low. The average close of those 16-down years was -13.98% the average Intra-year low was -22.34%. It is Important to consider, of those 16 years, 8 were what we would call "life changing events".

Anyways, have a great day, here's the latest blog: Stats for February
20240131-1.png
 
Friday

Good morning


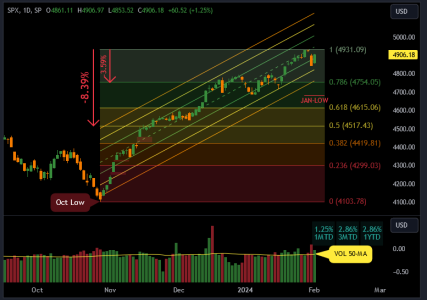
Since it’s Friday, and we love to feel good going into the weekend, I’m voting for a close at new all time highs for the S&P 500. This means we would need to close today than .52% which would also put us closer to Linear Regression “Fair Value” across the past 66 sessions.

20240202-0.png


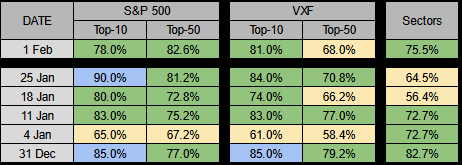
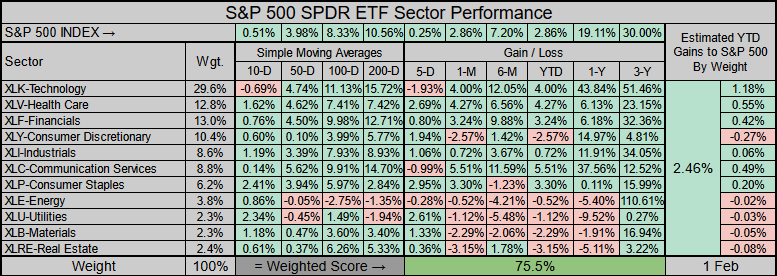
This week the S&P 500’s Top-10 lost strength and its Top-50 ran flat. The Extended Markets (outside the S&P 500) are slightly weaker, and the Sectors gained some strength.

20240202-1.png

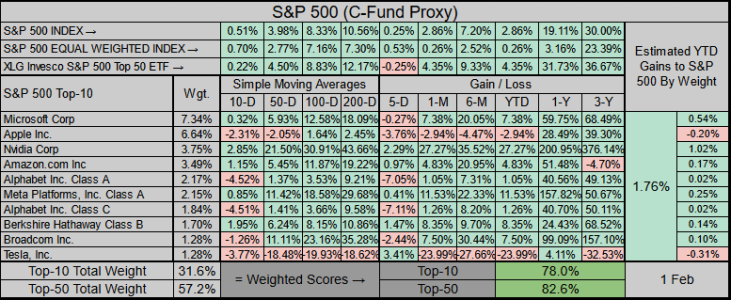
A while back Apple was knocked down to the #2 position and is no longer the daring love child (for the moment). Meanwhile, the new golden boy is Meta, with a good earnings report, stock buybacks, & announcing a dividend. The current bastard step-child is Tesla which has dropped down to the 10th position, from 28-Dec-2023 it lost -32.09% and gapped down -6.66% last week.

20240202-2.png


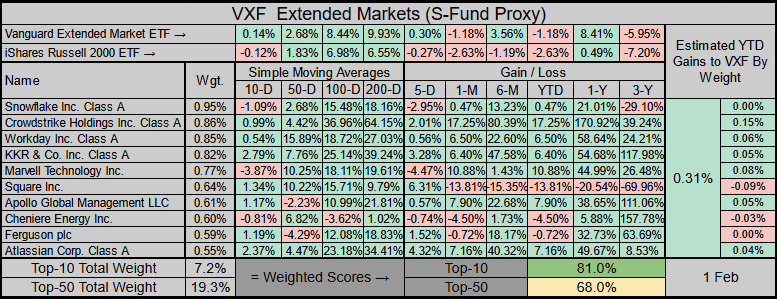
The Extended markets are mostly in a holding pattern, we're still waiting for the bid.

20240202-3.png


For the Sectors, I did notice a bit of rotation going on, if you’ll notice, Health Care, Finance, and Industrials are fully in the green.

20240202-4.png


At this moment, the Futures have been up, Top-50 ETF up, Tech up, should be a solid Friday, have a great weekend!
 
Sunday

Good Afternoon

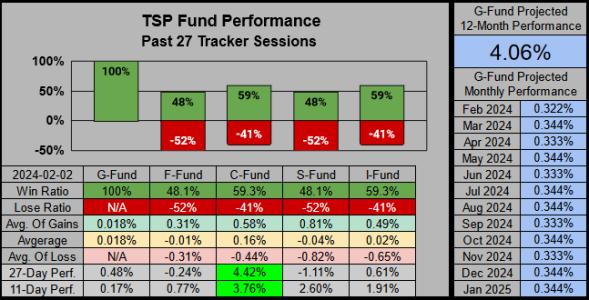
Across the past 27 sessions our C & I Funds are running strong, while the F & S Funds are weakest.

20240204-1.png

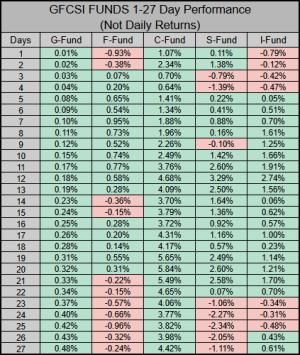
The C-Fund is dominating all other funds on the 1 to 27 day performance timeframe, it has the highest gains in each timeframe.

20240204-2.png

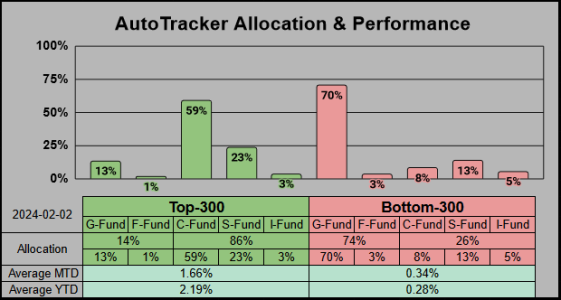
This week there’s very little allocation movement between the Top & Bottom 300. The C-Fund holds the 4th slot, C-Funders are winning.

20240204-3.png

For myself, while the 20% C-Fund allocation is already conservative, I do plan to exit sometime this month, then look for a lower re-entry. In the meantime, I’ll ride this wave and enjoy the low-risk gains.

20240204-4.png
 
Monday

Good morning, SPX 5050 anyone?

Across these past 67 sessions we closed Friday at Linear Regression’s centerline. From here it’s another .83% ride to sneak a peek into SPX 5,000.

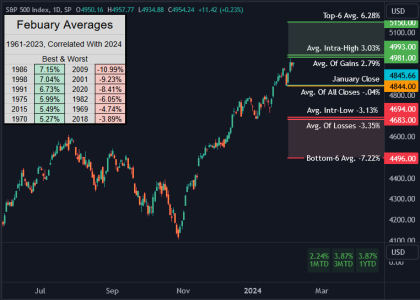
Something to keep in mind, the average intra-month percentage high (all closes) from the past 63 Februaries is 3.03% in today’s terms that’s SPX 4993. If we used only the 34 positive Februaries then the average intra-month percentage high (all positive closes) is 4.13% which in today's terms would be SPX 5046.

20240205-1.png


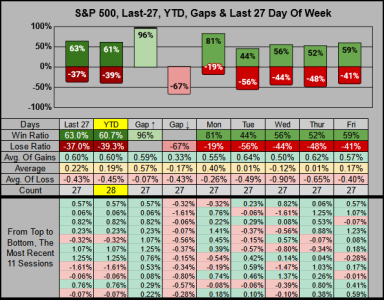
Gaps have been on point, the last 10 times SPX gapped down at the open, it closed the day down. Mon/Thur/Fri are winning, while Tue/Wed are under-performing.

View attachment 60154

It should be fun, have a great week!
 
Tuesday

Good morning, are we long-term toppy?

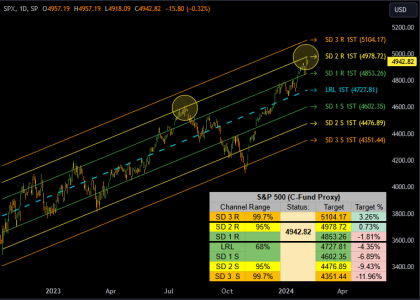
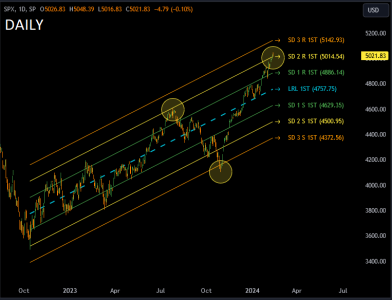
Here’s a quick look at the long-term Linear Regression Chart going back 329 sessions to the October 2022 Bear Market Bottom. Friday nearly tagged SD 2 R 1st (Standard Deviation 2 Resistance) you’ll notice the last time we approached these levels was in July 2023 (1st yellow circle).

20240206-1.png


As a comparison, I’ve drawn some LR channels going back 329 sessions from the July 2023 top, to see what that moment looked like. As we can see, July was also within the SD 2 R pocket, on this long-term timeframe.

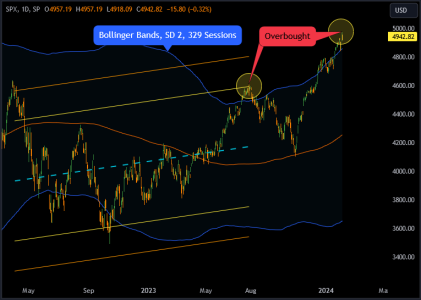
For a second comparison we can equalize the perspective by applying a set of Bollinger Bands using a SD 2 Deviation and 329 sessions long. From this perspective we were both overbought in July and are overbought now.

20240206-2.png

This in no way implies we are at the top, but I did think it was an interesting observation.
 
Re: Tuesday

It does seem a little frothy, and there are rumblings on MW of a pullback looming. Was considering stepping aside in consideration of that eventuality, but yet again, my IFT entry was overcome by professional commitment.
 
Re: Tuesday

It does seem a little frothy, and there are rumblings on MW of a pullback looming. Was considering stepping aside in consideration of that eventuality, but yet again, my IFT entry was overcome by professional commitment.


Yea, and that's why (aside from long-term holdings) I mostly trade sectors and large cap stocks. For active trading, I keep it down to less than 10 positions and not one of those positions is more than 3% of my portfolio. Given the current economic entertainment, I'm not gonna dip a toe in anything financial (aside from the sector). :smile:
 
Wednesday

Good morning

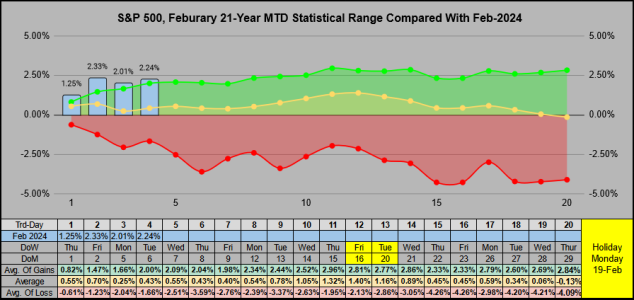
Over the past 21 months of February two particularly bad months brought the averages down. Feb-2020 lost -8.41% & Feb-2009 lost -10.99%. For some context, both those months are in the bottom 24 of the past 756 months or 63 years.
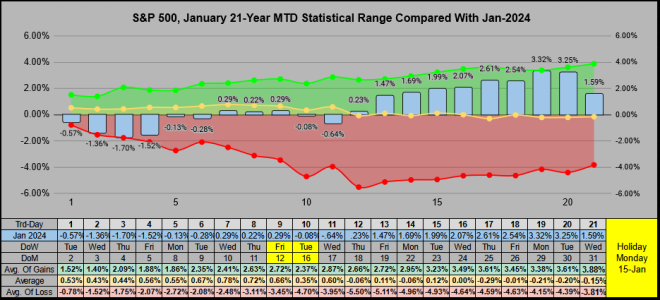
This month trading day 4 closed 2.24% MTD, which is above the average-of-all-gains.

Of the 12 times trading day 4 closed positive, the month closed with and average gain of .12%
– Of the 8 times the month closed positive, the average gain was 3.20%
– Of the 4 times the month closed negative, the average loss was -6.05% (thx to 2020 & 2009)

20240207-1.png

From the 63-year perspective, with only 4 days into February we are doing rather well. Sometimes it’s not good to “peak” too early into the month, so a bit of a rest might help us consolidate & build pressure, before we move higher (without getting exhausted).
20240207-2.png

 
Thursday

Good morning (Stepping on my soapbox)

In the past I’ve performed historical scans comparing the performance of my own personal “Four Horseman”, the Nasdaq 100, S&P 500, Russell 2000, & the Transports. To be blunt, I don’t care for the Transports, while it does serve as an economic indicator, overall I find it to be unreliable as a trigger for entering & exiting positions. From those studies, I find the NASDAQ 100 to be the most reliable, and the Transports to be the least.

The Transports make up 20 Equally Weighted Stocks with no weighted market cap to give the index momentum. Of those 20 stocks, only 13 are in the S&P 500, for a combined cap weight of 1.38% of the S&P 500. So even if the Transports were on the bull run of a lifetime, they can’t really can’t move the markets the same way a single stock like Microsoft can.

Stepping off my soapbox.

As Tom mentioned in his blog, “Following up on the recent strength in the market leading Dow Transportation Index, a breakout to a multi-month high was swatted back down yesterday with a negative reversal so perhaps a double top pullback is going to start now."

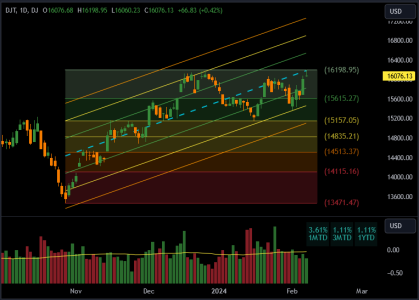
While the Transports have made a new high, they are still 3.20% under the July-2023 peak. From the Linear Regression viewpoint, 70 sessions off the October-2023 bottom we are fairly valued (just under the blue center-line). But looking at this chart, I see low conviction with the volume and performance wise it looks similar to the small caps, and definitely weaker than the large caps.

20240208-1.png

Lastly, Tom posted some good info on Feb Seasonality, given our most recent gains, it's possible some market movers will front-run the 19-Feb Monday holiday. Thanks for reading... Jason
 
Re: Thursday

This week I exited all short-term positions. Everything was booked for a profit and while nothing needed to be sold, sometimes I like to wipe the slate clean and take a fresh look without positions.

On that note, IFT EoB today 100G
 
Friday

Good morning

TLDR: So basically February’s high is not likely to be the high for the year, but the 1 time it was the yearly high, it was a bad year.

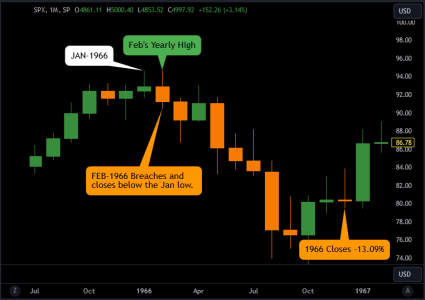
2024 is not 1966, but here’s an interesting stat. From the previous 63 years, Feb-1966 was the only year where the yearly high was in the month of February. Feb-1966 was an outside month, (both higher & lower than Jan), which ended up closing below January’s low. We finished 1966 down -13.09% which was the 6th worst of 63 years.
20240209-1.png


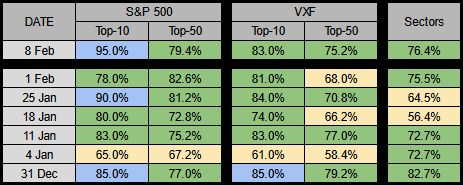
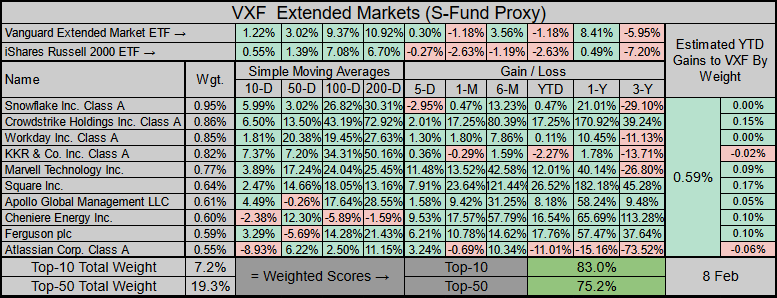
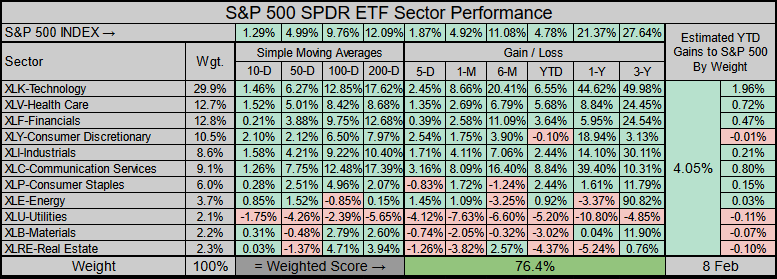
TLDR: S&P 500’s Top-10 provide the bulk of this year’s gains, small caps gain some minor strength, while the sectors run flat from the equally-weighted view.
20240209-2.png


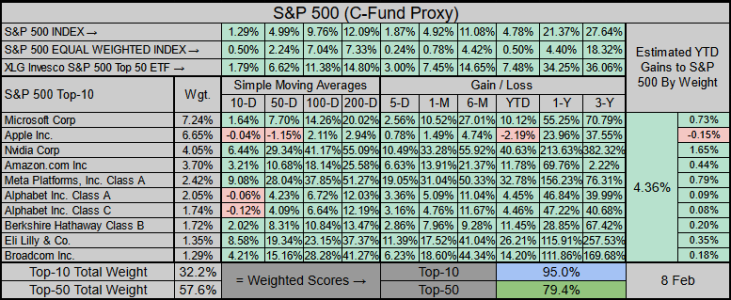
For the S&P 500’s Top-10, Apple is down -2.19% YTD, Nvidia rises to the 3rd slot, and Tesla drops to the 11th position.

The S&P 500 is currently up 4.78% YTD.
… 27% are beating the S&P 500
… 23% are not beating the S&P 500, but are up YTD

… 50% are down YTD
20240209-3.png


The small caps did gain some strength, but they are still underperforming, since the markets have re-priced in the rate cuts, I suspect this won’t change until the 2nd half of the year (we shall see).
20240209-4.png


For the Sectors, while the overall equal-weight score is only 76.4%, the Top-6 cap-weighted sectors (making up 84%) are doing rather well. The bulk of YTD gains are still from Tech, but at least we're starting to get contributions from the other sectors.
20240209-5.png

Have a great weekend!
 
Sunday

Good Morning

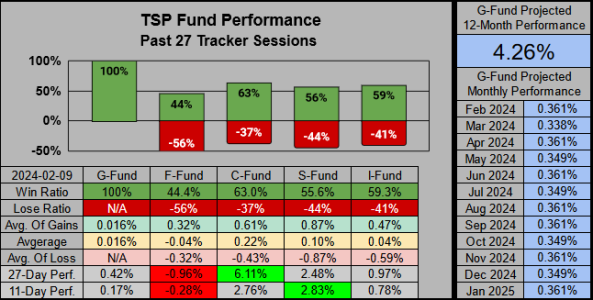
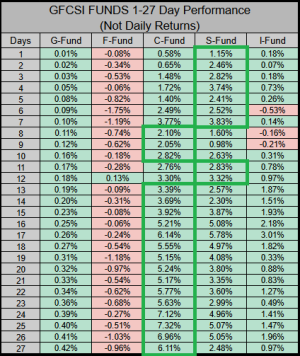
Across the past 27 sessions our C-Fund is still the leader, but on the shorter 11 day timeframe the S-Fund has earned higher gains.
20240211-1.png

Performance wise, the S-Fund is leading on the shorter time frames while the F-Fund is lagging across the board.
20240211-2.png


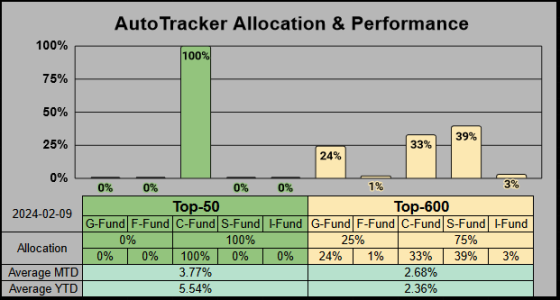
This week, the Top slot goes to user totallykool who is currently in the L45% Fund. Aside from this, the Top 50 are 100% allocated to the C-Fund. For the Top 600, this week The G-Fund is 19% lighter and the S-Fund is 21% heavier.
20240211-3.png

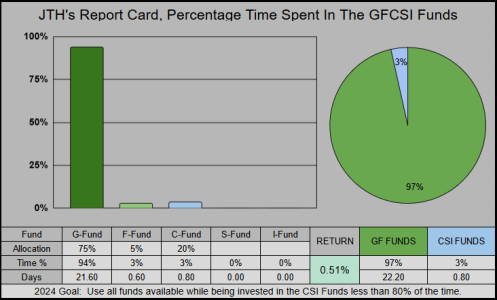
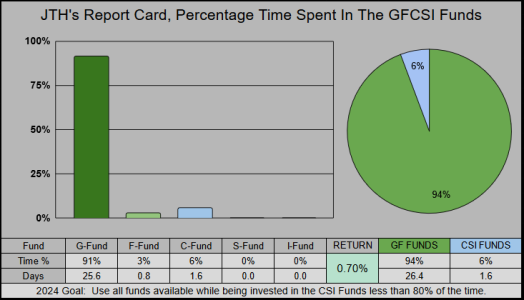
For myself, I’m now fully in the G-Fund. The 8-day 20% C-Fund allocation yielded .29%, while the 16-day 5% F-Fund allocation yielded a very small .00002%. So while I didn't lose anything on the F-Fund trade, it did underperform the G-Fund. Per the usual, I’ll look to re-enter at lower prices.
20240211-4.png

 
Monday

Good morning

Thus far, January has closed positive, and February has a higher monthly high, so what can history tell us?
From 1961, February’s high was higher than January’s high 36 of 63 times. From this, the year closed up 33 of 36 times, and the month of February closed up 27 of 36 times. Essentially this gives the year a 92% win ratio and February a 75% win ratio over those 36 years.
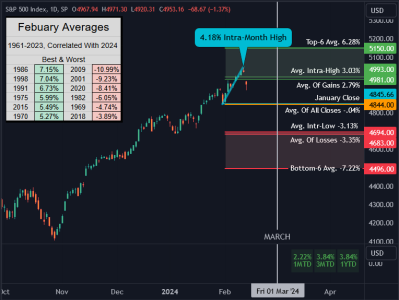
Pending Feb-2024's outcome... There were also 24 years where both Jan & Feb closed up. From this, the year closed up 23 of 24 times. The one year we closed down was 2011 with a -0.003% loss.


____
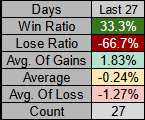
We are now 28 sessions into 2024, so I’ve switched over to the 27-day perspective. When the index gaps up at the open, the close has been positive 26 of 27 sessions. Over Thursday's past 11 sessions it has an 81.8% win ratio, but the last 27 Mondays have the best performance with an 81% win ratio.
20240212-1.png


Last Monday’s 11-session chart 20240205-2 had some missing data in the Gap Up category, so I’ve deleted it. Have a great week… Jason
 
Tuesday

Good morning

Here’s the long-term Linear Regression Chart going back 334 sessions to the October 2022 Bear Market Bottom. From this perspective we are very overbought.
20240213-1.png


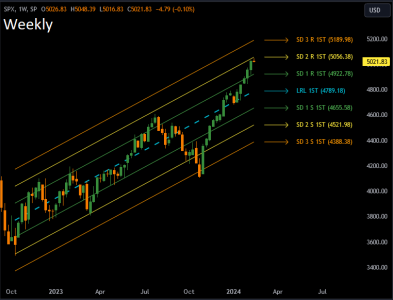
Since the candlesticks on the above chart are getting a bit congested, I’m switching over to the weekly timeframe. On this timeframe across 71 weekly sessions we can see we are still very overbought (but under SD 2 R). From this perspective we are about 5.6% above the centerline.
20240213-2.png

 
Just a quickie for those last minute IFTers

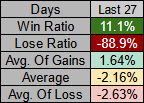
Last 27 times we gaped down -1% or less the day closed down 88.9% of the time with an average -2.16% loss or an average -2.63% loss on the days it closed down.
20240213-3.png


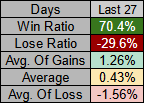
The next day's returns (tomorrow) had a 70.4% win ratio. with an average .43% gain or an average 1.26% gain on the days it closed up.
20240213-4.png
 
Just a quickie for those last minute IFTers

Last 27 times we gaped down -1% or less the day closed down 88.9% of the time with an average -2.16% loss or an average -2.63% loss on the days it closed down.
View attachment 60223


The next day's returns (tomorrow) had a 70.4% win ratio. with an average .43% gain or an average 1.26% gain on the days it closed up.
View attachment 60224

Watch out for Day 2 post gap down, (this Thursday).

20240214-3.png
 
Re: Thursday

Good morning (2nd post)

Last week, I had outlined a seasonal projection for SPX 5050. This target was met when we reached 5048 last Monday. “If we used only the 34 positive Februaries then the average intra-month percentage high (all positive closes) is 4.13% which in today's terms would be SPX 5046.”
20240214-0.png

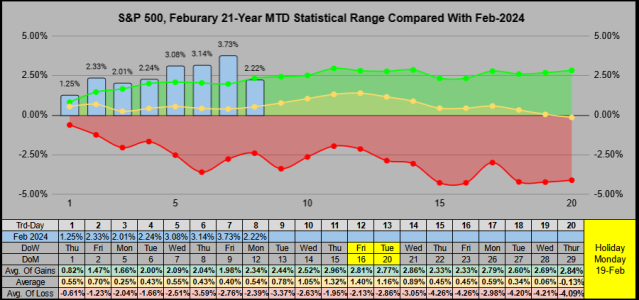
We are currently 2.22% MTD. From the 21-Year historical perspective, February trading day 8 had closed up 13 times, with the month closing up 10 times for an average 3.12% gain, or closing the month down 3 times for an average -7.34% loss (thx to a bad 2009 & 2020).
20240214-2.png

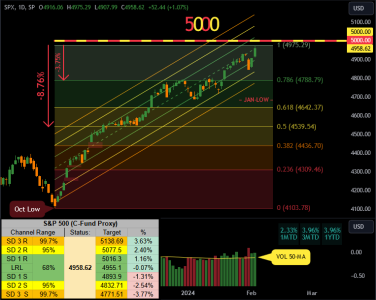
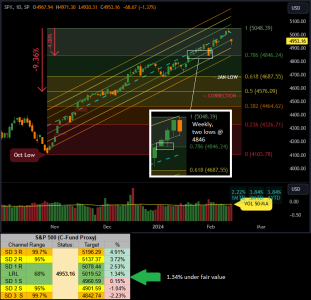
From the Fibonacci Top, it would be acceptable to retrace 4% down to the next .786% level at 4846. This might prove to be a key area because both the 31-Jan weekly low and the 22-Jan weekly low reside here (see white box).

The Oct-2023 Linear Regression Channel is now 74 sessions long and it shows 5019 as fair value's centerline (Blue Dashed Line). From this time & price range viewpoint we are also just a short -2.23% drop down to the orange standard deviation 3 support line @ 4843 (the same area as the two weekly lows).
20240214-1.png

In my mind, the highs for Feb are in, and while I did take some entries at Tuesday's open, it's likely a short-term play.

Good luck!

 
Back
Top