JTH
TSP Legend
- Reaction score
- 1,158
Re: Tuesday
Yea fun is subjective, but for me I love a good downturn. The markets have been over-priced and it'd be nice to re-value some of my holdings at a lower cost basis.
Good morning
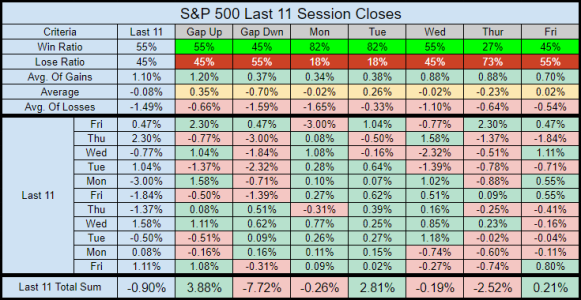
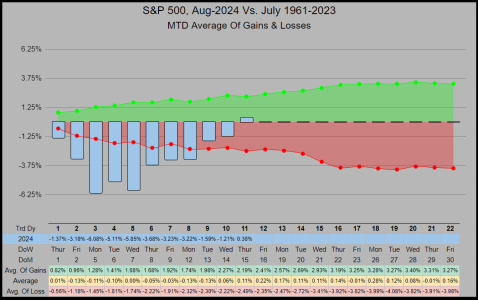
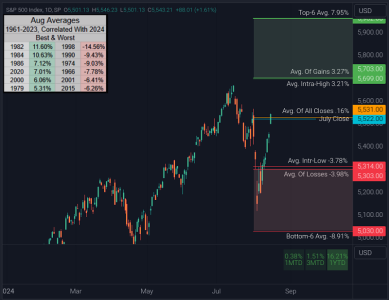
Tuesday’s price action had an average true range of 2.43%, but the index didn’t hold onto all of the gains, settling for a 1.04% close. It’s conceivable there’s plenty of traders in the hole who need to sell out of their positions as we go higher.
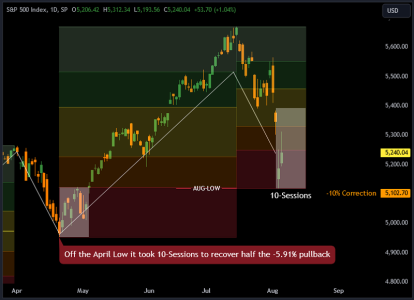
Off the previous April low, it took us 10-Sessions to recover half the losses and an additional 8 sessions to fully recover the pullback.
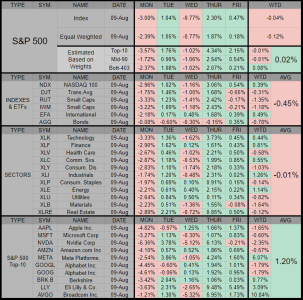
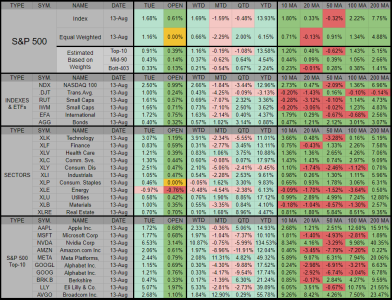
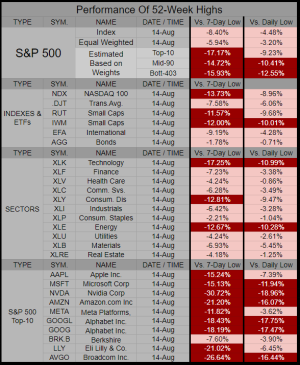
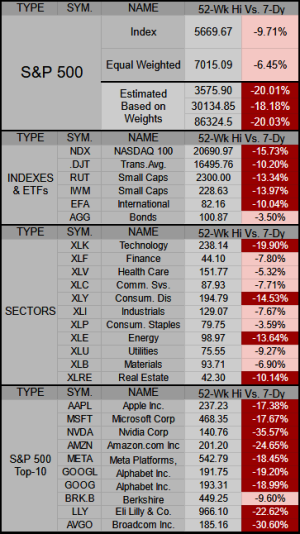
The Table below shows the extent of the damage, (in dark red) the 7-day low off the 52-Week-Highs has (in many instances) corrected more than -10% and in some cases more than -20%
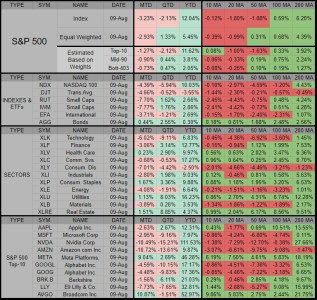
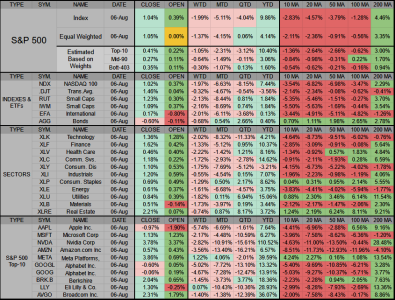
The table below (last column on the right) shows us 2 indexes, 3 sector ETFs, and 2 of the S&P 500’s Top-10 closed below their 200 Day moving average.
Not sure what your idea of fun is but for sure it will be interesting. Hopefully not frustrating.
Yea fun is subjective, but for me I love a good downturn. The markets have been over-priced and it'd be nice to re-value some of my holdings at a lower cost basis.
Good morning
Tuesday’s price action had an average true range of 2.43%, but the index didn’t hold onto all of the gains, settling for a 1.04% close. It’s conceivable there’s plenty of traders in the hole who need to sell out of their positions as we go higher.
Off the previous April low, it took us 10-Sessions to recover half the losses and an additional 8 sessions to fully recover the pullback.

The Table below shows the extent of the damage, (in dark red) the 7-day low off the 52-Week-Highs has (in many instances) corrected more than -10% and in some cases more than -20%

The table below (last column on the right) shows us 2 indexes, 3 sector ETFs, and 2 of the S&P 500’s Top-10 closed below their 200 Day moving average.


