JTH's Account Talk

Sunday

Good Sunday

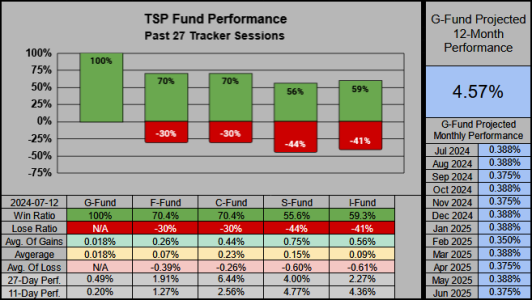
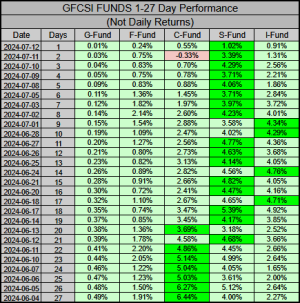
This week (for the 2nd consecutive time) the F & C Funds have the best 27-Day win ratio @ 70.4% The C-Fund has the most gains @ 6.44% followed by the S-Fund @ 4.00%
20240714-01.png

Performance wise, Only the 2-day performance of the C-Fund is in the red. Everything else is in the green, which is the most green we’ve seen since posting this data.
20240714-02.png

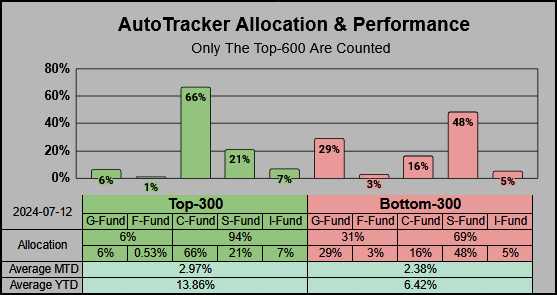
Although the S-Fund gained 4.06% last week, it wasn't enough to push the S-Fund crowd into the Top-300, but there was a modest allocation increase of 2.8% from the previous week.
20240714-03.png

Noteworthy: The Top-11 MTD @ 4.34% are all-in on the I-Fund. One of the elders & moderators of the forum, user member Frixxxx is sitting in the #1 slot.

Papohotel66 is in the #2 slot, and had an impressive 30.24% return last year.

 
Monday

Good morning

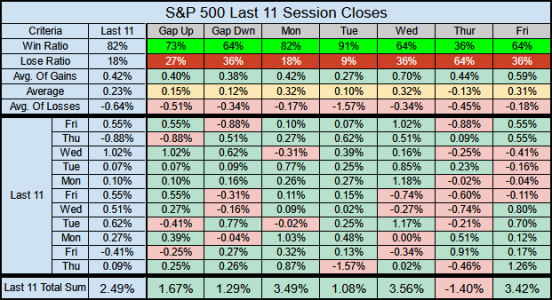
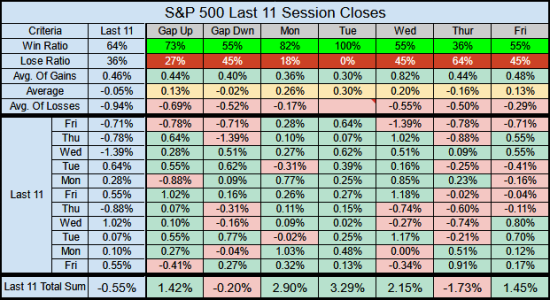
We’ve closed down twice over the past 11 sessions, giving us an 82% win ratio. Statistically we have some high win ratios with Monday at 82% & Tuesday at 91%.

We now have 10 consecutive positive Tuesdays. This doesn’t happen often, only occurring 3ish times over the past 63 years or 3,271 Tuesdays. Nov 2017 had a 9-run, but the 10th Tuesday closed dead-flat, does it count? The 3 official 10-runs happened in Mar 2013, April 2004, and Dec 1970.

We have only broken past 10 positive Tuesdays one time with a 13-run back in Dec 1971.

20240715-01.png


Last week the Index gained .87% with 73.6% of equally weighted holdings beating the Index and 56% of weighted holdings beating the index. While it was somewhat of a strange and volatile profit-taking week, where 6 of the Top-10 ended in the red, (from this chart perspective) the numbers were strong.

20240715-02.png


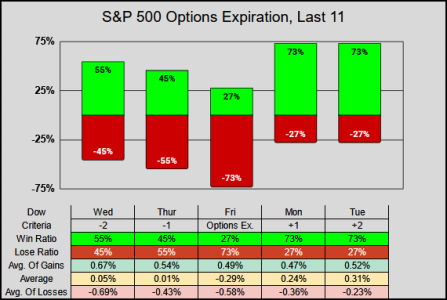
Options Ex is this week, while I don’t do options, I do like to watch the volume and look for trends. The current trend shows Thur/Fri look weak, with a pop on Mon/Tue.

20240715-03.png

Have a great week!
 
Tuesday

Good morning, here’s some speculation.

I realize economic data is bullish, but I also theorize much of this data was already priced into the markets months ago. At some point the markets should be looking to price in the rate cuts, and since the cake was already baked, there’s going to come a point where it’s time to start eating the profits.

In my mind I’m looking for a -10% correction to begin between now & mid August, possibly bottoming in September or early November. From there the remainder of the year may prove to be mostly a recovery of the previous lost ground. Thus far this year, damn near every respected money manager has been wrong on their projections, so if anything I'm in good company.


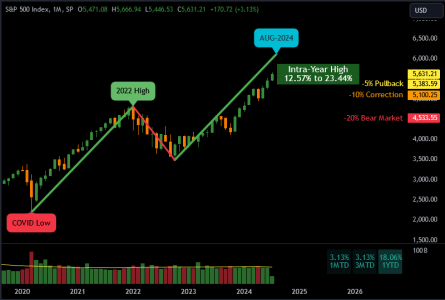
Anyhow… The measured move up pattern outlined in the 2024 Blog ends on 9-Aug. This pattern is also part of the estimated Intra-Year High ranging from 12.57% to 23.44%. This estimate takes SPX no higher than 5888, which is currently 3.90% above our 52-week high. In my math brain, the risk to reward ratio is diminishing greatly.

SPX MONTHLY
20240716-01.png


Re: Tuesday

Ironically, late July to August is when the election year seasonality chart heats up. That's for the S&P 500 though. Will small caps continue to have a mind of their own?

We're in the green line time line this year.

dailyguru62375.jpg


Source: (01/29/24) Seasonality, Historical Election-Year Patterns Point to a Solid

The Almanac is a well-treasured investment, worth every penny.

The 63-Year baseline I use only gives us 15-Cycles, Vs, their 18 cycles.
For 18 Cycles of year 4, we show an annual average of 7.26%
For 15 Cycles of year 4, we show an annual average of 7.95%

But.... (for the sitting President running) since 1949 a sitting president has ran for office a 2nd time, 12 times, so by this account they are using less data. But, with 2 presidents running against each other, I'd guess the markets already know what they are working with, so there's this aspect of stability to price in.

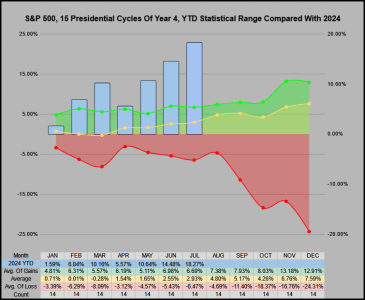
2024 YTD compared with the previous 15 Cycles Of Year 4, would rank us higher than the very best July/Aug/Sep and match Oct's best. It doesn't mean we won't go higher, it just concerns me that we are well outside the statistical norm (but I also think this is a very small set of data to work with).

Sry, I had to stretch this chart out to make it easier to see the averages.

20240716-02.png
 
Re: Tuesday

Is this the new trend?

Large Cap AI, Microsoft/Nvidia/Amazon/Meta/Google/Broadcom all below their 10-SMA, with some below the other SMAs.

20240716-03.png


Re: Thursday

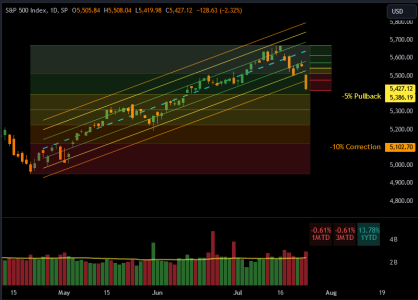
This morning the S&P 500 gaped down at the open -1.01% which is the largest gap down since 25-April at -1.02%

-1% or less gap down days are statistically special, the last 129 of these events take us back 63 years to 1961 of which 95% of these sessions closed down with an overall average loss of -2.02%

Of the 5% (or 7 sessions) that reversed the gap down and closed positive:

13-Oct-2022 (The very Bottom of the inflation scare)
24-Feb-2022 (One of many dead cat bounces off the 2022 bear Market)
15-June-2020 (Bounce off a 6-session -8.27% pullback)

The next and last 4 dates are all related to the Covid Market, 2-Jan-2019, 27-Dec-2018, 4-Apr-2018, 6-Feb-2018.

So here’s the observation: From 1961 to 5-Feb-2018 we have never reversed a -1% or less open gap and closed the session positive.

:banana:

 
Going outside my comfort zone, at 100C with only 1 IFT in the pocket, I'm not ready to go to the sidelines, but also don't like what I see with the C-Fund. The F & S Funds are holding up better today, so that's the shot I'm going to take.

IFT EoB Today 20F/80S
 
Friday

Good morning

If there were a proverbial line in the sand, we've touched it. I gave my speculative viewpoint on the 16th, if there was a time for the markets to cool off, retrace/pullback/correct, IMHO this is the best time. The one factor I can't account for is President Biden, if he decides to withdraw from the race this weekend, then we may get some volatile price action next week, and I have no idea which direction.


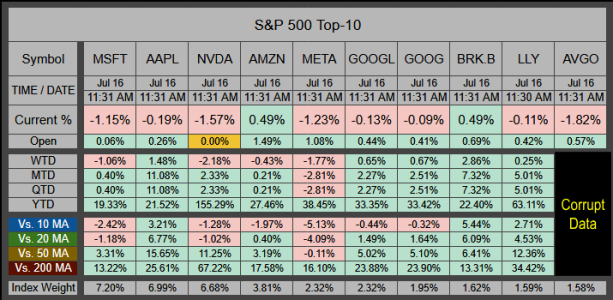
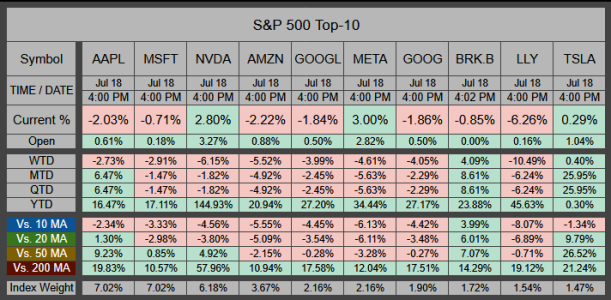
We've seen some shifts in the S&P 500's Top-10 which account for a weighted 34.84% of the Index.

Broadcom's AVGO has been replaced By Tesla's TSLA.

8 are down WTD, 7 down MTD.
9 Under the 10-MA, 7 under the 20-MA, & 5 under the 50-MA.

20240719-001.png

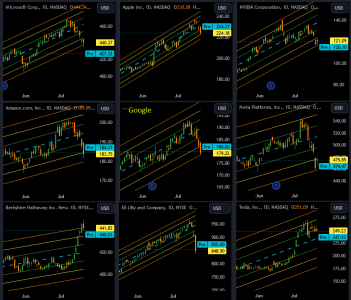
The 63-Session linear regression channel (representing a quarter's worth of price action) shows 8 of 10 are residing near the Standard Deviation Support-3 level. On this timeframe, 99.7% of prices are expected to be contained within this level. Generally speaking the longer the time-frame used, the more reliable these levels are. When markets have a strong trend, 63-sessions is a reliable timeframe, but it is certainly not unbreakable.

20240719-002.png
 
Re: Sunday

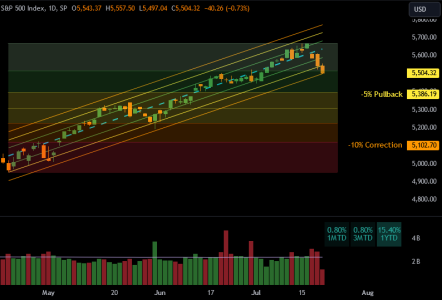
Today is the 63-session anniversary of the April-2024 bottom. This finalized a -5.91% pullback, the largest pullback we've had since the -10.92% Oct-2023 correction.

This 14.46% rising channel has been very kind to us, unfortunately giving some back is the price of admission....

20240719-004.png


Sunday

Good Sunday

Blog:
Strong Gaps: The New Norm


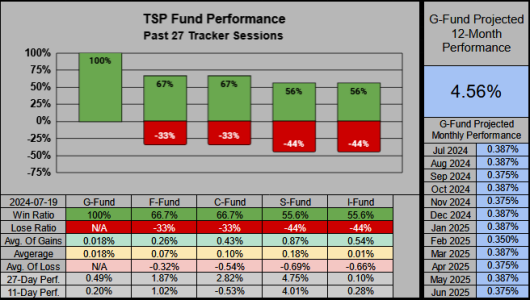
It’s our 3rd week with the F & C Funds having the best 27-Day win ratio, but the most gains belong to the S-Fund at 4.75%

20240720-01.png


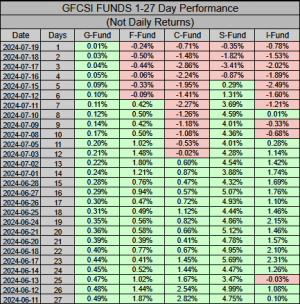
Performance wise, across the FCSI funds the last 4 sessions have been unkind, with our C-Fund in the red out to day 12.

20240720-02.png


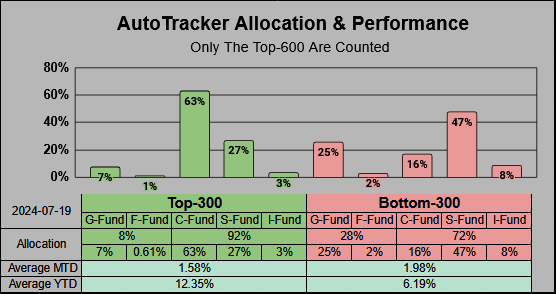
The Top-300 continue to predominantly be in the C-Fund, but there was a modest 5.9% allocation increase with the S-Fund. The 100% S-Fund herd starts at position 361, so most of the S-Funders in the Top-300 have mixed allocations.

20240720-03.png


Have a great week….Jason
 
Monday


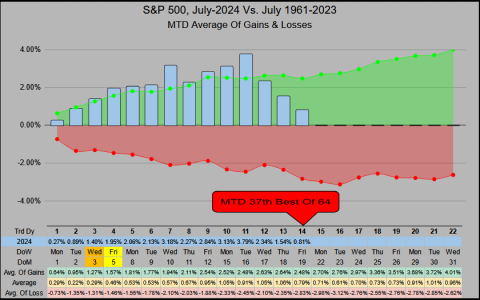
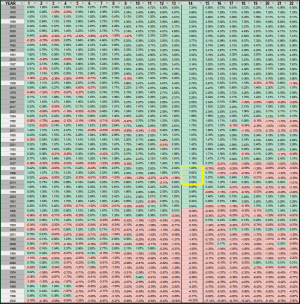
Prior to the 17-July sell off, we were on track for a Top performing month where we were mostly ranking in the upper 33 percentile, targeting a monthly close in the range of 3.60%. Last Friday’s MTD Trading Day 14 closed at .81% MTD, ranking 37th of 64, (lower than previous expectations). Statistically speaking, it’s a warning sign the Month of July is in danger of closing in the red.

20240721-01.png

The table below shows trading day-14 sorted from best to worst. The yellow box is where we reside in relation to the previous 63 months of July, with the column on the far right showing us each monthly close. I realize the numbers are hard to read, but it's the colors which give us an overall view of where we currently stand.

20240721-02.png


Monday & Tuesday continue to be both the most winnable & profitable days of the week. We have 11 consecutive positive Tuesdays, making it the 2nd best run over the previous 63 years.

Friday marked 3 consecutive sessions down, we haven’t triggered a 4th session down since the 6-run off the April bottom (62 sessions ago).

20240721-03.png

Should be an exciting week!
 
Tuesday

Good morning

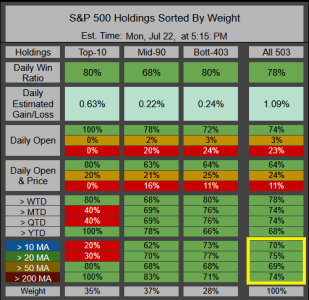
Thus far, the recent 3-day retracement hasn’t been strong enough to cause legitimate fear. We still have 70% of holdings above their 10-MA, and 69% above the 50-MA

20240723-00.png
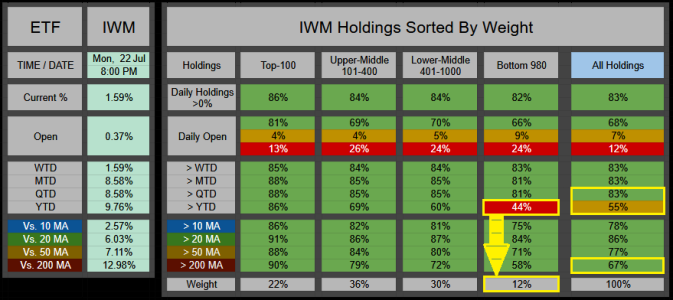
A quick review of Russell 2K's ETF IWM and its holdings. This chart has to pull & calculate 40K points of data, so it won’t be 100% accurate, but it’s close.

67% of IWM’s holdings are trading above the 200-MA.
55% of IWM’s holdings are positive YTD, with 83% positive QTD.
As expected, most of the poor performance comes from the weighted bottom 12% of the ETF, with only 44% positive YTD.

20240723-01.png

 
Re: Tuesday

Good morning

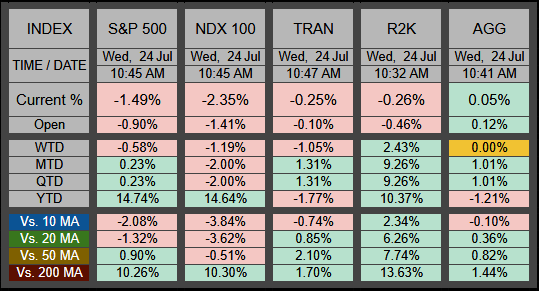
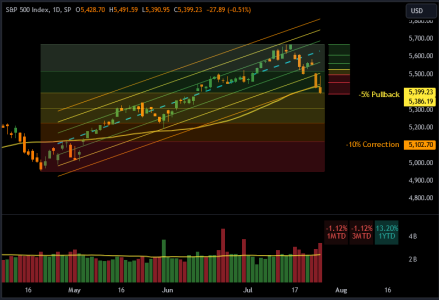
Nothing significant to report, we had some strong gaps down at the open, and the NASDAQ 100 is the first to breach its 50-MA.

20240724-01.png


Re: Tuesday

This may be the Nasdaq 100's make or break catalyst. Nvidia doesn't report for another month, but their chart looks to be in a crucial pivot point. It's had a failed head test of the head and shoulders pattern and a breakdown below the neckline, but the 50-day is really trying to hold.

tsp-072424b.gif
 
Re: Tuesday

This may be the Nasdaq 100's make or break catalyst. Nvidia doesn't report for another month, but their chart looks to be in a crucial pivot point. It's had a failed head test of the head and shoulders pattern and a breakdown below the neckline, but the 50-day is really trying to hold.

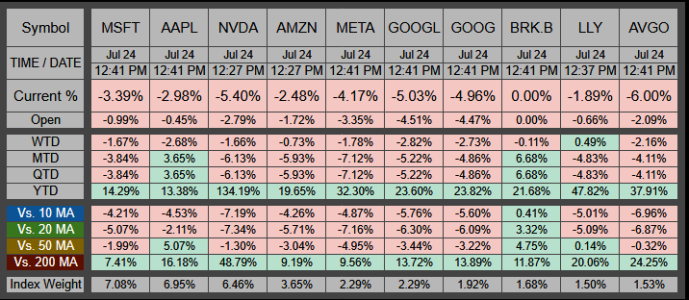
Off the 20-June Top NVDA has lost -17.91% :suspicious:

Impressive action, we now have 8 of the Top-10 below the 50-MA and down MTD/QTD.

If that's not a rotation, I don't know what is....but IWM is certainly doing better (or less worse).


20240724-02.png
 
Sunday

Good Sunday

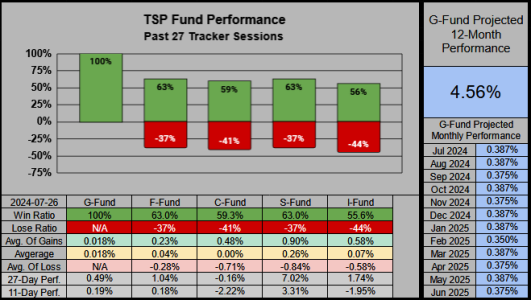
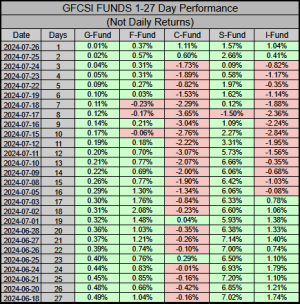
While the C-Fund is near flat, the S-Fund has the best 27-day performance with an impressive 7.02% gain.

20240728-01.png


Here we can see the C-Fund took the brunt of the damage during the recent pullback.

20240728-02.png


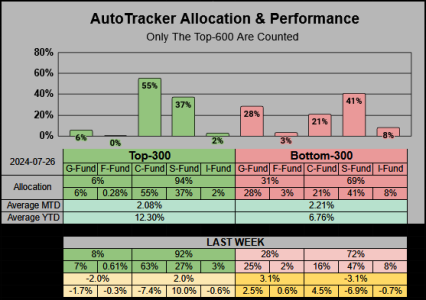
Since the S-Fund’s performance (both going up & going down) has improved, our Top-300 saw a 10% increase in the S-Fund’s allocation while the C-Fund’s allocation decreased -7.4%

20240728-03.png
 
Back
Top