JTH's Account Talk

Monday

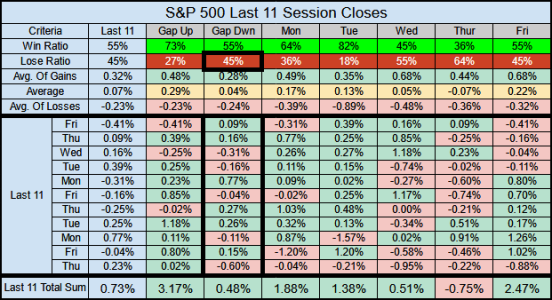
The last 11 times the Index gapped down at the open, it closed the session down 45% of the time. Typically this stats runs at 70% down, so (at this time) IFT buyers have been at a disadvantage when trying to scoop up lower prices.
20240701-02.png

Over the past 63 sessions, the S&P 500 has a cumulative gain of 3.99%, but the past 63 Mondays have been the most profitable at 16.18%

20240701-03.png

The past 252 Mondays have the best Day-of-Week win ratio and 2nd best gains, with Friday having the best gains.

20240701-04.png

 
Re: Sunday

For years it looked like the "S" was the kid to beat. Well now it looks like the "C" fund has done it.
 
Re: Sunday

For years it looked like the "S" was the kid to beat. Well now it looks like the "C" fund has done it.

From what I've read (although not back-tested for myself) is that small caps will begin to out-perform as we exit a recession. Therein lies the problem, we haven't yet entered a recession and it's somewhat questionable if or when we will. My long-term exposure to small/mid caps is through the Vanguard's VXF ETF, it's done better than other small cap ETFs at 1.98% YTD, but I also keep it at less than 15% of my portfolio.

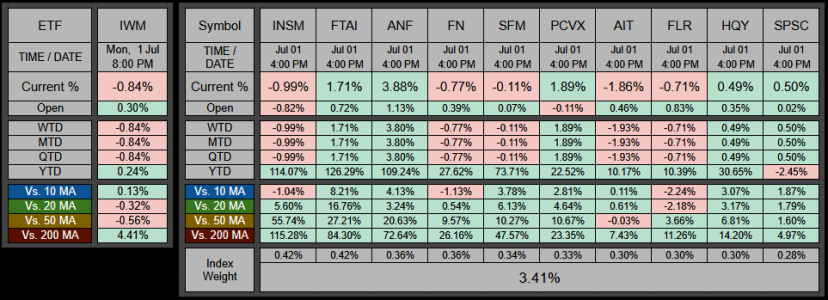
Of IWM's 1,994 YTD holdings I can track, only 792 are positive YTD (about 40%).

But this 40% of YTD winners makes up a weighted 50.58% of the entire index, so they don't have enough clout to pull the index up.

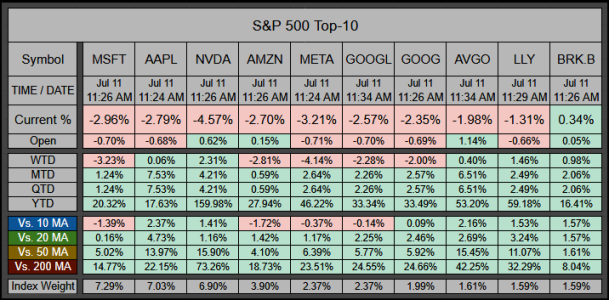
Our Top-10 is actually doing really well, with 7 outperforming the S&P 500 YTD, but those Top-10 only make up a weighted 3.41% of the index.

20240702-1.png
 
Last edited:
Tuesday

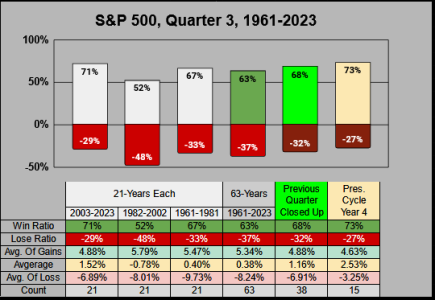
2nd Quarter 2024 earned 3.92% ranking 24th best of the 64 yearly Q2s.

For Q3, overall we have some good win ratios, the past 21 years is 71% and when Q2 closed up Q3 was 68%
The larger caution, (although it does lose less often), when it does lose, it losses more.
In the first five columns, the average-of-losses is greater than the average-of-gains.

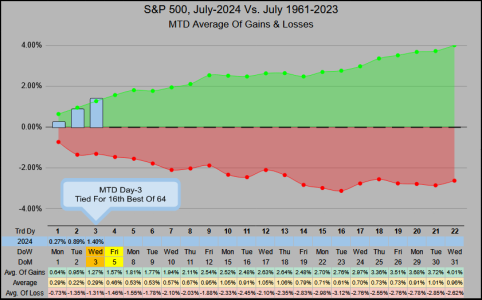
BLOG: Stats for July


20240700-05.png
 
Re: Thursday

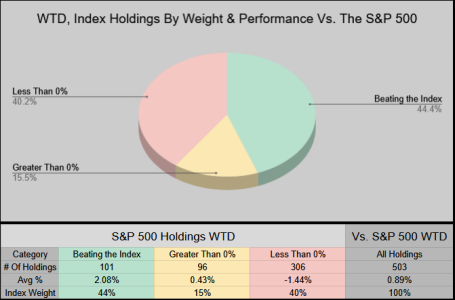
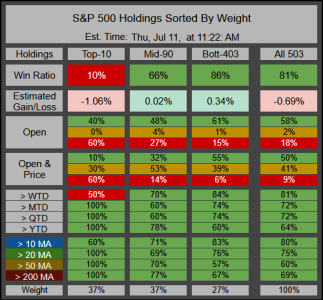
Never one to avoid going down a rabbit hole (thanks Tom) here's a representation of the S&P 500's holdings vs. the index itself. This is WTD data (which technically is also MTD & QTD).

101 holdings are beating the Index WTD, with an average gain of 2.08% and an index weight of 44%

As long as this green slice of the pie remains the largest weighted slice, then (from this viewpoint & timeframe) I would view the index as more bullish than bearish.

Although the yellow slice is positive (but less than the index) we could view it as neutral, and the red slice as bearish.

20240703-01.png
 
Sunday

Good Sunday

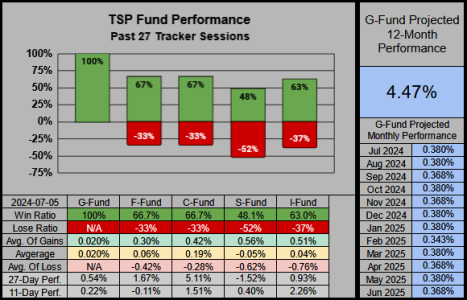
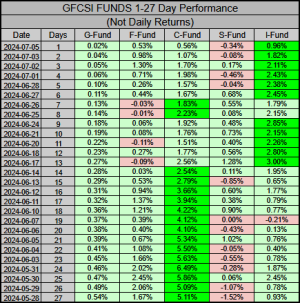
This week the F & C Funds have the best 27-Day win ratio @ 67.7%. Across the past 27-sessions, our C-Fund has the most gains @ 5.11% followed by the F-Fund @ 1.67%. On the shorter 11-day scale, the I-Fund has the most gains at 2.26%

20240707-01.png


Performance wise, of these 27 sessions, the C-Fund is a sea of green, but our I-Fund is the better performer from days 1-6 & 9-13.

20240707-02.png


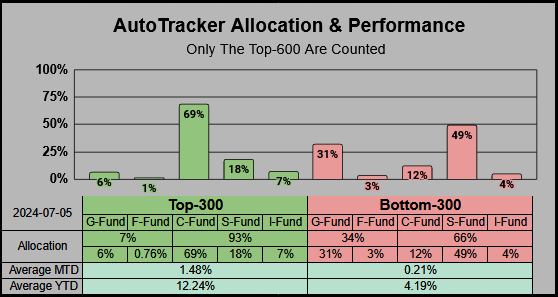
The YTD average of the Top-300 is nearly 3X that of the Bottom-300. Of the Top-300, The C-Fund has a 69% allocation. Breaking it down by the C-Fund: Top-50 100%, Top-100 92%, Top-150 82%, Top-200 76%, Top-250 70%

Also (in case you haven’t noticed), the I-Fund is in the Top-300 at position 261.

20240707-03.png

 
Monday

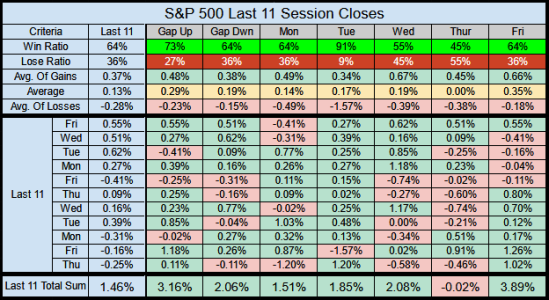
This is the 4th Monday I’ve highlighted the unreliability of a negative opening gap closing the session down. This statistical deviation makes it difficult for buyers to IFT into the C-Fund at the IFT Deadline, and expect to get lower end of day prices.

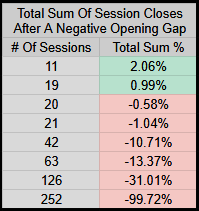
Over the past 11 sessions which gaped down, the total sum of closes is positive at 2.06%, this isn’t the statistical norm. Typically the total sum of closing sessions (after a gap down) is negative. In this case we have to go back 20 negative opening gaps to get a negative total sum of sessions. Here are some examples of the total sum of sessions after a negative gap, which highlights the deviation from the norm over the past 19 sessions.

20240708-00.png


Looking at the rest of the data, our last 9 Tuesdays & 4 Wednesdays have closed positive. While this does give Tuesday a 91% win ratio, the most profitable day of the week has been Friday at 3.89%

20240708-01.png
 
Tuesday

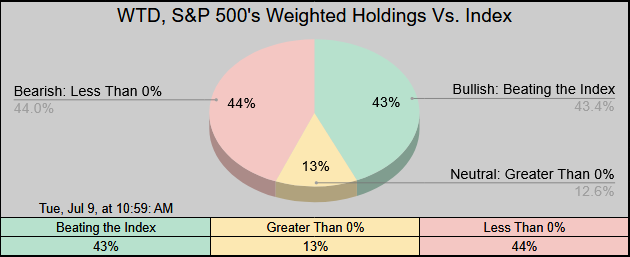
Week to Date, it's been a decent battle between the Bulls & Bears.

Much of Monday & Partial Tuesday have seen the Bears outnumber the Bulls, but the bulls have better gains and more weight per holding. On the weighted scale, "roughly speaking" it's this 13% of Neutral holdings which have been switching us back & forth between red & green.

20240709-01.png


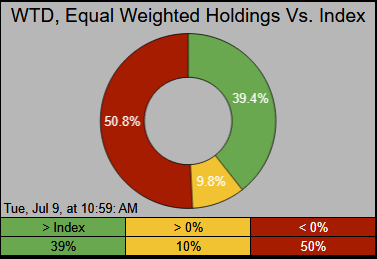
On the equally weighted scale it's about as evenly matched as it gets.

20240709-02.png
 
Thursday

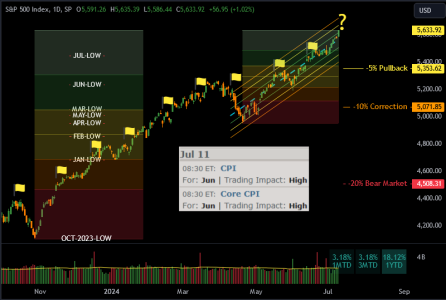
So it's that time of the month again, where we get to plant another yellow flag, the CPI gets posted today.

20240711-01.png
 
Re: Thursday

The rest of the index looks good, so perhaps a rotation day.


This is why I moved to 100% C-fund today. I like that the broader market is up today now that the first rate cut is seemingly locked in, but I can't get myself to buy the S-fund which is up more than 2% from yesterday with a fresh open gap in its chart. It is also not easy to buy the C-fund with its just coming off a streak of new highs with plenty of room to pull-back, but I'll take its lower price today and a chance to catch the rotation oscillate back to the top stocks.
 
Re: Friday

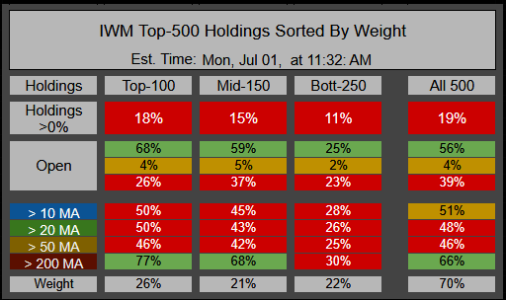
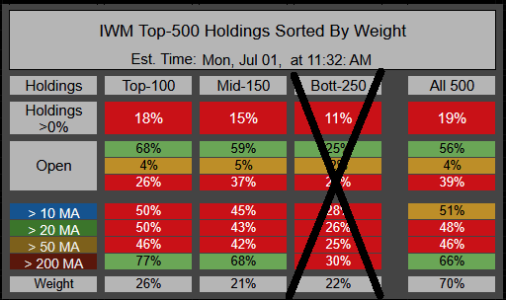
It's looking like a tough day for small caps, only 19% of the Top-500 are in the green.

Last week I posted a chart of the IWM's Top-500. The data on the Bottom-250 Column was calculated incorrectly.

20240712-01.png


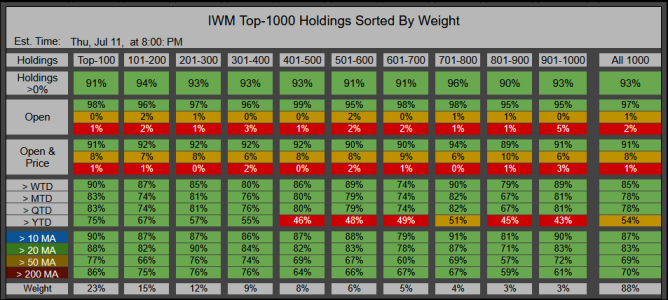
As of Thursday's close, here's a breakdown of IWM's Top-1000 weighted holdings broken down into increments of 100. Keeping in mind that MTD & QTD are the same data until we move into August. Either ways, my current assessment of IWM is better than my previous assessments.

This Top-1000 is a weighted 88% of the index.

Holdings >0%, Open, Open & Price, is Daily Data only (in this case Thursday's price action). We can see as we dip down into the 400s and below, the YTD performance goes into the red.

20240712-02.png


Re: Wednesday

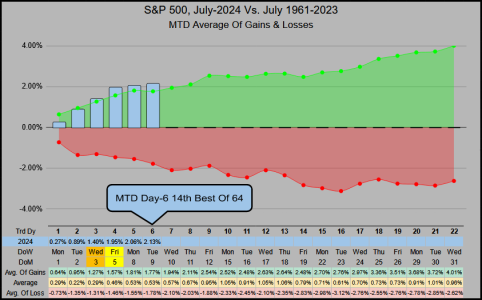
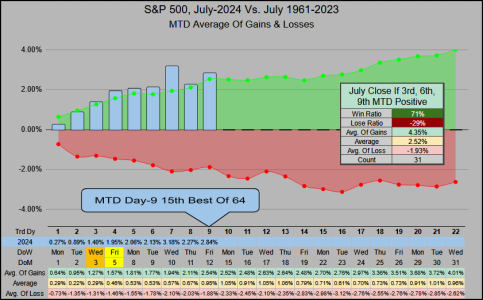
In reference to the 3rd column of the 4th chart in the Stats for July blog, we are on track for a winning month.

From 63 years, there have been 31 times where the 3rd, 6th, & 9th MTD was positive. Statistically this led to a 71% win ratio with an average gain of 4.35%, or a 29% lose ratio with average loss of -1.93%

20240713-01.png

 
Back
Top